Transperth
Transperth is the brand and operating name of the public transport system in the greater metropolitan area of Perth.
The Transperth system consists of a bus network, a fully-electrified urban train system and a ferry service. It is managed by the Transperth branch of the Transperth System, Regional and School Bus Services (SBS) division and covers such key functions as system planning, bus service delivery, passenger information services, ticketing and bus fleet procurement.
Transperth bus and ferry services are provided under commercial contract arrangements; Transperth train services are provided under an internal service level agreement by the PTA’s Transperth Train Operations (TTO) division.
Passenger information is provided through Transperth InfoCentres, the Transperth InfoLine service and the Transperth website. The Perth Station InfoCentre is operated by TTO; all other InfoCentres are operated under contract by Serco.
Objectives and outcomes
| OBJECTIVE | OUTCOME |
|---|---|
Continue to pursue patronage growth, high passenger satisfaction and a high level of on-time running (OTR) |
|
Further improvements to bus services |
|
Encourage public transport use |
|
Continue to improve information provided to passengers |
|
Ensure that adequate public transport services to major events across the metropolitan are planned and funded |
|
Install a platform detection system on the A-series railcars |
|
Select a preferred tenderer for the railcar maintenance and cleaning contract |
|
Improve facilities for bus stowage |
|
Key service measures
Patronage and services
Following the extension of SmartRider-based free travel in April 2009, patronage is reported under three categories to ensure valid comparisons over time.
- Cash and SmartRider initial boardings, (i.e. fare-paying cash and SmartRider boardings and free travel on SmartRider).
- Total initial boardings (cash and SmartRider initial boardings plus free bus travel on Perth Free Transit Zone (FTZ) services and on Central Area Transit services in Perth, Fremantle and Joondalup, and on the Midland Shuttle).
- Total boardings (total initial boardings plus transfer boardings).
NB: Free travel on SmartRider refers to travel by WA seniors and aged and disability pensioners on weekdays from 9am to 3.30pm and all day weekends and public holidays. It includes all-day free travel by veterans and PTA current and some retired staff, and train travel within the FTZ which is only available to SmartRider users. Previously (since June 1999) WA Seniors Card holders were entitled to free travel only on Sundays and public holidays.
The growth rate of patronage on the Transperth system increased in 2010-11. Total boardings rose 3.3 per cent, and cash and SmartRider initial boardings by 2.5 per cent, compared with increases of 2.2 per cent and 1.6 per cent respectively in 2009-10. This represented a resumption of the slow but steady growth rate which had preceded two years of significant increases (2007-08-09) reflecting the introduction of the Mandurah Line.
Free travel by seniors and pensioners accounted for 7.642 million total boardings, up 5 per cent from 2009-10’s 7.276m. Initial boardings by seniors and pensioners rose 2.4 per cent to 4.735m, from 4.624m previously.
The following chart shows total boardings and cash and SmartRider initial boardings (which correspond to fare-paying boardings reported up to 2007-08) over the five-year period to 2010-11. Total boardings were up 3.3 per cent to 135.975m, from 131.629m in 2009-10. Cash and SmartRider initial boardings rose 2.5 per cent, from 78.852m to 80.817m.
Transperth System: Patronage (millions)

Passenger place kilometres - which represent the total passenger-carrying capacity of the Transperth bus, train and ferry network - also recorded an increase but at a lower rate than in the previous three years. This metric is based on service kilometres and the average capacity of the fleet.
Transperth System: Passenger place kilometres (millions)

Passenger place kilometres rose 4.4 per cent to 10,579.9m following increases of 8.6 per cent (to 10,138.4m) in 2009-10, 13.3 per cent in 2008-09 and 25 per cent in 2007-08. Total capacity provided on the Transperth system has increased by 60.4 per cent since 2006-07, with the main contribution to the increase coming from the expansion of the train network. This reflects the extension to Clarkson and Thornlie, the introduction of three and six-car trains, and the opening of the Mandurah Line - passenger place kilometres went from 2998.3m in 2006-07 to 6838.7m in the latest year.
The contribution of the bus network to the increase has been much more modest, over the longer period and in the latest year - bus passenger place kilometres increased 1.6 per cent to 3736.1m following a 0.4 per cent decline in 2009-10 and increases of 1.5 per cent and 1.3 per cent in the preceding two years.
Access to public transport
The graph overleaf shows that an increasing proportion of PSAs in the Perth public transport area (PPTA) are within walking distance (500 metres) of a Transperth stop providing an acceptable service level (ASL). An ASL is defined as a 20-minute or better service in the peak flow direction during the peak, and at least an hourly service throughout the core of the day.
Access to public transport: Proportion of PSAs in the Perth Public Transport Area within 500m of a Transperth stop providing an acceptable level of service
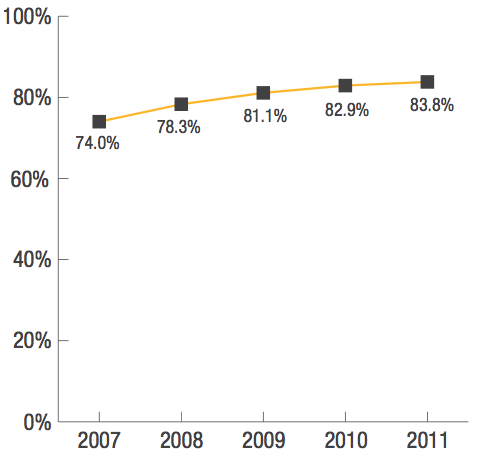
Transperth uses GPS (global positioning system) data to measure the level of accessibility to public transport facilities. The exact location of all bus stops and train stations is identified and accessibility to these facilities is measured against other spatial data - in this case PSAs.
In 2011, 83.8 per cent of PSAs in the PPTA were within 500m of a stop providing an ASL, compared with 82.9 per cent in 2010. There was a total of 876,549 PSAs in the PPTA compared with 863,460 in 2010 and 840,731 in 2009. The number of PSAs within walking distance of an ASL stop was 734,349 in 2011 compared with 715,719 in 2010 and 681,989 in 2009. The number of PSAs within walking distance of Transperth facilities providing an ASL increased 38 per cent from 532,271 in 2007 to 734,349 in 2011.
The number of ASL stops increased by 2.2 per cent to 7468 in 2011 compared with 7309 in 2010. The significant improvement in the level of PSA access to Transperth facilities occurred with the introduction of the feeder bus network in the southern suburbs to serve the Mandurah Line. This is reflected in the rapid increase in the number of ASL stops between 2007 and 2008 from 5969 to 6698 (12.2 per cent) and to 7279 in 2009 (8.7 per cent).
Reliability
Transperth: Service reliability by mode Proportion of services meeting on-time targets
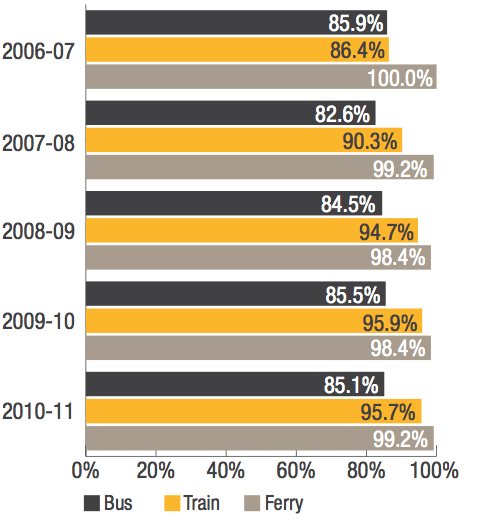
The OTR of Transperth bus and ferry services is measured by the GPS Reporter functionality of the SmartRider ticketing system; for trains, through the train control system. These technology-based monitoring methods allow more precise data-gathering than the physical checks and manual observations used previously.
Though the bus, train and ferry services met their reliability targets, actual OTR results for the year were down marginally. On buses, which have a target of 85 per cent, 85.1 per cent of services met the criteria, compared with 85.5 per cent in 2009-10. Rail (target 95 per cent) was 95.7 per cent (95.9 per cent previously) while ferries (target 98 per cent) achieved an outstanding 99.2 per cent (98.4 per cent previously).
Passenger satisfaction
An independent market research firm commissioned by Transperth carries out the annual Passenger Satisfaction Monitor (PSM) to assess the level of satisfaction/dissatisfaction among passengers in regard to various aspects of Transperth services.
The graph shows the proportion of respondents who expressed overall satisfaction with the quality of service on Transperth bus, train and ferry operations, calculated as the weighted average across all modes.
Transperth System: Level of overall customer satisfaction

In 2011, 84.4 per cent of users across the Transperth system expressed overall satisfaction with the quality of service provided, compared with 85.8 per cent in 2010. The slight downturn reflected a slip in the satisfaction rating of rail passengers - overall satisfaction with bus and ferry services increased.
Passenger safety
Transperth System: Proportion of respondents who generally feel safe on board during the day
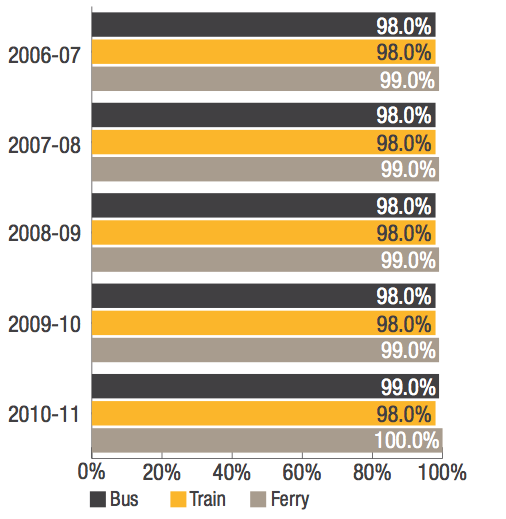
Note: Measures relating to customer perception of safety at other times and at stations/interchanges are shown in sections dealing with individual modes.
The PSM assesses customer perceptions of safety during the day and at night, aboard buses, trains and ferries, and at bus and train stations and ferry jetties. This chart shows that virtually all passengers felt safe aboard Transperth buses, trains and ferries during the day.
Efficiency
In 2010-11, the average total cost of providing Transperth services increased by 1.5 per cent, from $0.526 per passenger kilometre in 2009-10, to $0.534. Total system cost rose 5.9 per cent while passenger kilometres rose 4.1 per cent.
Transperth system: Total cost per passenger kilometre (Passenger kilometres: To 2007-08 based on average trip length derived from the zonal distribution of tickets. From 2008-09 average trip length based on SmartRider tag-on/tag-off data)

The noteworthy feature of the trend shown in the graph is the 31.8 per cent reduction in average cost between 2007-08 ($0.781) and 2008-09 ($0.533). This significant reduction was due to a change in the method of determining the average trip length in calculating passenger kilometres.
Since 2008-09, SmartRider tag-on/tag-off data has been used to calculate the average trip length for bus and train passengers. This provides a precise basis for the calculation as it accurately records the length of each SmartRider journey leg on both initial and transfer boardings.
SmartRider initial boardings used for the calculation comprise fare-paying boardings plus free travel by seniors, aged and disability pensioners, veterans, and PTA current and some retired staff.
The average trip length for bus and train SmartRider users is then applied to cash initial and transfer boardings. Estimated trip lengths are applied to boardings on bus services in the FTZ, and boardings on CAT services and the Midland Shuttle.
Until 2007-08, the average trip length was based on the zonal distribution of ticket sales and validations. Calculating 2007-08 passenger kilometres using average trip length based on SmartRider tag-on/tag-off data results in a total cost per passenger kilometre of $0.535 for 2007-08, 31.6 per cent less than the reported figure of $0.781.
Expenditure and revenue
Transperth System: Expenditure ($ millions)

Note: Total expenditure in 2006-07 includes CUC.
Transperth System: Revenue ($ millions)

Total expenditure on Transperth services was $731.78m, up 5.9 per cent from $691.172m in 2009-10. Operating expenditure (excluding capital charges) was $523.948m, up 5 per cent from $499.108m. Annual capital charges (interest and depreciation) were $207.842m, up 8.2 per cent from $192.064m. Across the modes, bus total costs and bus operating costs both increased by 10.4 per cent; train total costs increased by 2.1 per cent while operating costs fell 1.3 per cent; and total and operating costs of the ferry service fell 4.7 per cent and 7.4 per cent respectively.
There were several key factors behind the increase in system costs in 2010-11:
- Increased labour costs on both bus and train services
- Higher fuel costs on buses and increased railcar energy costs
- The addition of 1.2m service kilometres (an increase of 2.3 per cent) to total bus kilometres operated during the year
The rising trend in Transperth’s revenue continued in 2010-11. Total revenue was $169.494m, up 8.9 per cent from 2009-10’s $155.659m. Fare revenue was $155.854m, up 10 per cent from $141.735m.
Fare revenue includes full or part funding for CAT services, contributions for the provision of specific bus services, joint ticketing revenue (where the public transport fare is included in the price of the event ticket), Commonwealth funding for concession travel by interstate seniors, and income from the sale of SmartRider cards. As well as fare revenue, total revenue takes other income (advertising, rent, etc.) into account.
The 2009-10 slide in fare-paying boardings which followed the introduction of free off-peak travel for seniors and pensioners, was reversed in 2010-11. While fare-paying boardings on buses rose only 0.7 per cent, train and ferry operations chalked up significant increases of 4.4 per cent and 3.9 per cent respectively. System-wide, fare-paying boardings increased 2.5 per cent compared with a decline of 3.1 per cent in 2009-10.
The 10 per cent increase in fare revenue (compared with a 4.8 per cent rise in 2009-10) was the result of both the increase in fare-paying boardings and the higher fares introduced in July 2010. The new schedule increased standard fares by an average of 2.7 per cent and concession fares by an average of 8.9 per cent.
Looking at fare revenue by individual mode, buses recorded an increase of 10.2 per cent, trains 9.8 per cent and the ferry 7.1 per cent.
Review of performance
Service reliability
Transperth uses technology-based monitoring methods to measure OTR. The GPS Reporter functionality of the SmartRider ticketing system is used to monitor bus and ferry services, while the train control system is used for train services.
Trains
The target for TTO in 2010-11 was for 95 per cent of services to arrive within four minutes of the scheduled time. Until 2006-07, this tolerance margin was three minutes. It changed in 2007-08 to take account of longer rail services with increased journey times, and to ensure consistency in reliability measures between Transperth’s train operations and other Australian rail operators.
In 2010-11, 95.7 per cent of train services met the target (95.9 per cent in 2009-10).
Buses
The service reliability target for Transperth buses is to never leave a terminus or travel through a mid-way timing point early, and for 85 per cent of services to arrive within four minutes of the scheduled time.
Bus reliability is monitored on the basis of a random sample of one per cent of trips in each bus contract area (a substantial number, given that there are more than 11,000 bus trips on a typical weekday). This provides an accurate assessment of bus on-time performance. No other public transport jurisdiction in Australia has the technology or capacity to provide this precise level of automated checking of bus services.
In 2010-11, we surpassed our OTR target when 85.1 per cent of bus services operated within the four-minute tolerance period. This was marginally below the level achieved in 2009-10 when 85.5 per cent of services met the target. SmartRider technology helps to identify under-performing services which, after a careful review, are re-scheduled to ensure improved performance.
Ferries
The target for our ferries is for services to arrive within three minutes of the scheduled time. In 2010-11, 99.2 per cent of services met this target compared with 98.4 per cent in 2009-10. During the year, out of 123 trips checked (1.0 per cent of total round-trips), one trip ran late.
Trends in patronage
Patronage on the Transperth system increased for the twelfth year in succession, though the rate of increase in the past two years has slowed compared with exceptional growth in 2008-09 and 2007-08 following the start of services on the Mandurah Line.
In 2010-11:
- Total boardings (fare-paying boardings, free travel and transfers) were a record 135.975m, up 3.3 per cent from 2009-10’s 131.629m
- Cash and SmartRider initial boardings (fare-paying boardings and SmartRider-based free travel excluding free train travel within the FTZ) rose 2.5 per cent to 80.817m (previously 78.852m)
- System-wide, fare-paying boardings reached 75.929m, up 2.5 per cent from 2009-10’s 74.103m. In 2009-10, fare-paying boardings fell 3.1 per cent, reflecting the first full-year impact of free off-peak travel for seniors and aged and disability pensioners (introduced on April 4, 2009)
All cash and SmartRider initial boardings are recorded accurately on the Transperth ticketing system. In 2010-11, SmartRider accounted for 70.4 per cent of system-wide cash and SmartRider initial boardings (including free train travel within the FTZ), up from 69.9 per cent in 2009-10, 66.7 per cent (2008-09) and 61.0 per cent (2007-08). Because the SmartRider system records transfers accurately, this data provides a reliable model to estimate transfers for cash passengers.
In longer-term trend analysis, from 2006-07 to 2010-11, total boardings on the Transperth system increased by 34.7 per cent, while cash and SmartRider initial boardings (excluding free train travel within the FTZ) rose 30.4 per cent. During this period, total boardings increased at an average annual rate of 4.4 per cent on buses and 13.3 per cent on trains. The average annual rate of increase of cash and SmartRider initial boardings was 2.3 per cent on bus and 13.7 per cent on trains.
Patronage on the Transperth ferry service tends to fluctuate, partly due to the fact that a high proportion of users are tourists. In 2010-11, ferry total boardings rose 1.6 per cent following a 4.1 per cent fall in 2009-10.
On a per-capita basis, public transport usage within the Perth metropolitan area (including the City of Mandurah) was 53.8 total initial boardings per annum (comprising fare-paying boardings and all free travel), compared with 53.0 in 2009-10 and 54.0 (2008-09).
Marketing of the service
In 2010-11, the Transperth Information and Event Services team successfully undertook a wide range of initiatives:
- Continued with the popular I Give Two Hoots campaign launched in 2009-10 to improve courtesy among passengers. The campaign is designed to highlight behaviour that passengers find irritating, such as playing loud music, not moving away from train doors and trying to board a train when passengers are still trying to alight.
- Developed new station InfoCubes on station platforms to provide passengers on the train system with timetable and stopping pattern information.
- Developed new signage on ticket machines to help passengers purchasing tickets.
- Improved signage at Perth Underground as part of a system-wide upgrade. The new signage improves visibility of key components of infrastructure, such as lifts, to make them easier to identify for those who need to use them.
- Continued to provide service disruption information to passengers across all modes of public transport. There was a significant increase in the number of disruptions due to work on the Perth City Link project.
- Continued to deliver Get on Board presentations to a broad range of community groups. Work started on a workplace program designed for employers who want to encourage staff to use public transport to access their workplace.
- Continued to work with major event organisers to ensure the provision of special events.
- Conducted the annual PSM and undertook research to better understand the interface with cyclists.
Disability access
Transperth aims to provide universal access to its buses, trains and ferries so that the wider community (including people with disabilities and parents with prams) can access services and facilities. In 2010-11, further progress was made towards achieving this objective.
Trains
All Transperth trains are universally accessible. The key issue for the train operation is whether access to the station is provided for people with varying disabilities and whether the gap between train and platform meets accessibility standards.
At June 30, 37 out of 70 train stations (52.9 per cent) provided independent access for people with disabilities and parents with prams, compared with 23 out of 59 (39.0 per cent) in 2006-07. At the other stations, passengers are helped by PTA customer service staff when required.
| Independent access* | Partial access** | Limited access** | Total stations | Proportion providing independent access | |
|---|---|---|---|---|---|
2006-07 |
23 | 26 | 10 | 59 | 39.0% |
2007-08 |
34 | 25 | 10 | 69# | 49.3% |
2008-09 |
36 | 25 | 9 | 70 | 51.4% |
2009-10 |
36 | 25 | 9 | 70 | 51.4% |
2010-11 |
37 | 24 | 9 | 70 | 52.9% |
* Complies with the Disability Standards for Accessible Public Transport and Guidelines under the Disability Discrimination Act, 1992.
** Assistance available from Transperth customer service staff.
# Perth Underground Station included in Perth Station in 2007-08, identified as a separate station from 2008-09.
Buses
Transperth continued its long-term program to increase the number of accessible buses in its fleet with the purchase of 88 new low-floor accessible buses as part of the Daimler Chrysler bus supply agreement. As at June 30, Transperth operated 905 accessible buses out of a total fleet of 1170 (77.4 per cent) compared with 826 (72.1 per cent of 1146 vehicles) previously.
Preference is given to operating accessible buses whenever possible so that, off-peak, most buses are accessible. In the peak, accessible and non-accessible buses are fully committed. Accessible buses accounted for 83 per cent of service kilometres in 2010-11, compared with 80.3 per cent previously.
The PTA has a responsibility to ensure that the bus fleets in regional towns meet the Federal legislated requirement in regard to accessibility. During the year, eight diesel low-floor buses were transferred to regional towns, part of the State’s public transport system managed by the PTA. This completes the program to transfer 41 buses to regional areas over a four-year period.
Transperth continued its program of upgrading accessibility at bus stations and bus/train interchanges to meet the requirements of the Federal Disability Standards for Accessible Public Transport. During the year, the Mirrabooka bus station was upgraded to provide full access to people with disabilities together with improved toilet facilities and increased CCTV coverage.
Ferries
During the year, the bulk of Transperth ferry services was provided by the accessible ferry, the MV Phillip Pendal, which was brought into service in May 2009. The MV Shelley Taylor-Smith, an accessible vessel, is also available for use when required.
The Barrack Street jetty in Perth meets Federal Disability Standards for Accessible Public Transport. While the Mends Street jetty in South Perth was accessible to people in wheelchairs, the existing ramps were improved during the year. Planning is in progress for the construction of a new jetty at Mends Street to meet all accessibility standards and provide improved facilities.
Service coverage
Transperth aims to maximise the number of people in the community who have ready access to its services. Service coverage is measured by the proportion of PSAs within the Perth public transport area that are less than 500m from a Transperth stop (bus, train, or ferry) providing an ASL. An ASL is defined as an hourly service during the day with at least three trips, i.e. at 20-minute intervals, in the peak flow direction in the morning and afternoon peaks.
In 2010-11, the proportion of PSAs within 500m of an ASL stop increased to 83.8 per cent, from 82.9 per cent in 2009-10. The number of ASL stops increased to 7468, from 7309.
Passenger satisfaction
The 2011 PSM showed that, system-wide, 84.4 per cent of our customers are satisfied with the overall level of service, compared with 85.8 per cent in 2010. (Details of passenger satisfaction with train, bus and ferry services are included in individual mode reports from page 28).
SmartRider project and system ticketing
Transperth’s SmartRider ticketing system continues to improve on its success, and lead Australia in smartcard ticketing technology.
Over 2010-11, SmartRider accounted for 70.4 per cent of system-wide cash and SmartRider initial boardings, compared with 69.9 per cent in 2009-10. The share of SmartRider in each mode was, on average, bus 70 per cent (69.6 per cent previously), train (including free travel within the FTZ) 71.2 (70.5) per cent and ferry 36.5 (32.6) per cent.
In view of the growing acceptance of the electronic smartcard ticketing system, a Corporate SmartRider was introduced during the year. This new product allows organisations to add value to an employee’s SmartRider or the corporate SmartRider without the need to take each card to a reload agency. The discount provided for users of the Corporate SmartRider is 25 per cent of the cash fare.
During the year, Kalgoorlie and Bunbury became the third and fourth regional towns to have SmartRider-equipped public transport services. (SmartRider was successfully introduced to the regional towns of Geraldton in 2008-09 and Busselton in 2009-10).
The 2011 PSM showed a very high level of satisfaction with SmartRider - 97 per cent among bus passengers, 96 per cent among train passengers and 94 per cent among ferry passengers.
Complementing the SmartRider system, state-of-the-art ticket vending machines have been installed at all train stations and ferry jetties to provide a cash alternative for passengers.