Audited Key Performance Indicators
Certification of Key Performance Indicators
For the year ended 30 June 2011
I hereby certify that the key performance indicators are based on proper records, are relevant and appropriate for assisting users to access the Public Transport Authority’s performance, and fairly represent the performance of the Public Transport Authority of Western Australia for the financial year ended 30 June 2011.

R Waldock
Accountable Authority
5 September 2011
Key Performance Indicators
To make its contribution to the Government’s goal, ‘To enhance the quality of life and wellbeing of all people throughout Western Australia’, the PTA has adopted two outcomes:
- Accessible, reliable and safe public transport system
- Protection of the long-term functionality of the rail corridor and railway infrastructure
It aims to achieve the first of these outcomes through the:
- Metropolitan and Regional Passenger Services - these include
- Perth Metropolitan Train, Bus and Ferry Services of Transperth; and
- Regional Town Bus Services;
- Country Passenger Rail and Road Coach Services of Transwa; and
- Regional school bus services.
The indicators of success in achieving this outcome and running these services are based on the use of public transport, accessibility, reliability, customer satisfaction, safety and cost efficiency.
The PTA aims to achieve the second outcome - protection of the long-term functionality of the rail corridor and railway infrastructure - through its quality management of the rail corridor and residual issues for the rail freight operations which were leased to private sector operators in 2000.
Links to the Government Strategic Goal
The links to the Government Strategic Goal are presented in the table below:
| Government Strategic Goal | PTA Outcomes | Services |
|---|---|---|
| To enhance the quality of life and wellbeing of all people throughout Western Australia | Accessible, reliable and safe public transport system |
|
| Protection of the long term functionality of the rail corridor and railway infrastructure |
|
Outcome 1: Accessible, reliable and safe public transport system
Effectiveness Indicators
The PTA’s effectiveness in providing an accessible, reliable and safe public transport system is measured using the following key effectiveness indicators for:
- Use of public transport
- Accessible public transport
- Service reliability
- Level of overall customer satisfaction
- Customer perception of safety
- Level of notifiable safety incidents.
1. Use of Public Transport
The use of public transport is measured by comparing the annual number of passengers carried with the number of service kilometres. Service kilometres are kilometres operated on scheduled passenger services and exclude “non-productive running” i.e. travelling to or from the depot to commence a service trip or re-positioning to commence another service trip.
The measure indicates the extent to which services provided, as represented by the number of kilometres operated, are being utilised. An increasing trend in the indicator will generally signify that patronage is rising at a rate greater than the rate of increase in service kilometres operated and represents an improvement in effectiveness as well as an increase in the use of public transport.
This effectiveness indicator is applied to each mode of public transport. The indicator is based on total boardings on Transperth services and includes fare-paying boardings plus free travel and transfers. Transfers are boardings which occur either between services within the same mode or between modes during the specified ticket transfer time.
Transperth Bus Services

Total boardings reached 76.636 million in 2010-11 compared to 74.756 million in 2009-10 and the target of 75.087 million, an increase of 2.51 per cent over 2009-10 and 2.06 per cent above the target. Additional CAT and Ellenbrook services were delivered from October 2010 onwards. As a result service kilometres increased by 2.31 per cent to 53.551 million kilometres from 52.340 million in 2009-10 and exceeded the target of 52.552 million by 1.90 per cent.
Transperth Train Services

Boardings per service kilometre on Transperth train exceeded the target by 6.87 per cent. Total boardings reached 58.868 million from 56.409 million in 2009-10 and the target of 56.301 million, an increase of 4.36 per cent from 2009-10 and 4.56 per cent above the target. The increased boardings were due to the increase of number of car bays at stations and additional railcar sets in service. Train service kilometres recorded 14.307 million compared to the 2009-10 result of 13.582 million service kilometres, an increase of 5.34 per cent but were 2.25 per cent below the target of 14.637 million.
Regional Town Bus Services
Intra-town services operate within rural town boundaries, while inter-town services run between regional centres.
a. Intra-Town Services

The indicator reached 0.990, below the 2009-10 result of 1.004 and below the target of 0.993 in 2010-11. This is a decrease of 1.37 per cent from 2009-10 and 0.28 per cent below the target.
In 2010-11, intra-town services in Albany, Bunbury, Collie, Geraldton, Busselton, Carnarvon, Esperance, Karratha and Manjimup recorded decreases in passengers carried per service kilometre when compared to 2009-10. Public school bus service that used to operate between Kalgoorlie and Coolgardie, and Kalgoorlie and Kambalda were transferred over to the PTA’s School Bus Services (SBS) branch. Total patronage was 2.411 million compared to 2.466 million in 2009-10, a decrease of 2.23 per cent. Service kilometres also decreased by 0.91 per cent to 2.435 million kilometres from 2.457 million in 2009-10.
b. Inter-Town Services

The indicator reached 0.016, below the 2009-10 result of 0.018 and the target of 0.018 in 2010-11. This is a decrease of 11.11 per cent compared to 2009-10 and the target. This is due to the combined effect of the reinstatement of the Kalbarri and Monkey Mia feeder services in November 2010 and an increase in service kilometres and passenger numbers of the Pilbara service run by the Shire of East Pilbara. As a result, service kilometres increased by 18.11 per cent from 345,614 kilometres in 2009-10 to 408,220 in 2010-11 and total patronage rose by 2.58 per cent from 6,368 in 2009-10 to 6,532.
Transperth Ferry Services

The indicator reached 13.64, above the 2009-10 result of 13.43 and below the target of 14.16 in 2010-11. This is an increase of 1.56 per cent from 2009-10 and 3.67 per cent below the target.
The target was based on projected annual total boardings of 489,000 and 34,530 service kilometres. During the year, ferry boardings increased by 1.55 per cent from 464,125 in 2009-10 to 471,338 but were lower than the target by 3.61 per cent. Annual service kilometres decreased slightly from 34,559 kilometres to 34,555 but were marginally (0.07 per cent) above the target.
Transwa Rail Services

The indicator reached 0.235, below the 2009-10 result of 0.242 and above the target of 0.230 in 2010-11. This is a decrease of 2.71 per cent from 2009-10 and 2.36 per cent above the target.
The marginal (0.36 per cent) decrease in service kilometres from 996,279 in 2009-10 to 992,669 and the decline of 3.22 per cent in patronage from 241,484 in 2009-10 to 233,711 in 2010-11 have contributed to the lower result compared to the previous years.
Transwa Road Coach Services

The indicator reached 0.066, below the 2009-10 result of 0.067 and below the target of 0.070 in 2010-11. This is a decrease of 1.33 per cent from 2009-10 and 5.56 per cent below the target. This is due to a decline in patronage and a 0.05 per cent decrease in service kilometres (from 3.222 million kilometres in 2009-10 to 3.220 million in 2010-11).
2. Accessible Public Transport
Accessibility to public transport, in terms of service coverage, is measured as the proportion of Property Street Addresses (PSA) within the Perth Public Transport Area (PPTA) which are within 500 metres of a Transperth stop providing an acceptable level of service. The PPTA defines the core operational areas for Transperth services.
Acceptable Service Level (ASL) is defined as an hourly service during the day with at least three trips per hour (i.e. at 20-minute intervals) in the peak flow direction in the morning and/or afternoon peaks, excluding dedicated SBS.
The indicator uses PSA data from Landgate and service information and stop location data from the Transperth Route Information System (TRIS).
The measure demonstrates the extent to which the PTA meets its accessibility standards in the Perth metropolitan area.

The indicator reached 83.78 per cent, above the 2009-10 result of 82.89 per cent and above the target of 81.00 per cent in 2010-11. This is an increase of 1.07 per cent from 2009-10 and 3.43 per cent above the target. While the number of PSAs within the PPTA increased by 1.52 per cent to 876,549 in 2010-11 from 863,460 in 2009-10, the number of PSAs within 500 metres of an ASL stop increased by 2.60 per cent to 734,349 from 715,719 in 2009-10. The 2010-11 result indicates that a very high proportion of PSAs in Perth, 734,349 out of 876,549 have ready access to an acceptable level of public transport services.
3. Service Reliability
According to an independent survey which measured customer satisfaction, service reliability is regarded as one of the most significant characteristics of a quality service. Service reliability is essentially a combination of two main factors, punctuality and consistency.
Services are considered to be punctual if they arrive within a defined period of time after the scheduled arrival time. This parameter is referred to as On-Time Running (OTR).
| Operation | ‘OTR’ parameter |
|---|---|
Metropolitan and Regional Passenger Services |
|
| Transperth Trains | 4 minutes |
| Transperth Buses | 4 minutes |
| Transperth Ferries | 3 minutes |
Country Passenger Rail and Road Coach Services |
|
| Transwa Rail | |
| Prospector | 15 minutes |
| Australind | 10 minutes |
| AvonLink | 10 minutes |
| MerredinLink | 10 minutes |
| Road Coaches | 10 minutes |
Regional School Bus Services |
|
| Drop off no less than 10 minutes before school starts and pick up within 10 minutes of school ending. | |
The ‘OTR’ measure demonstrates the extent to which the PTA meets its service reliability standards.
Transperth Train Services

The indicator reached 95.71 per cent, below the 2009-10 result of 95.90 per cent and above the target of 95.00 per cent in 2010-11. The ‘OTR’ of Transperth Trains in 2010-11 was marginally higher (0.75 per cent) than the target but marginally below (0.20 per cent) the previous year’s result.
Transperth Bus Services

The indicator reached 85.13 per cent, below the 2009-10 result of 85.54 per cent and above the target of 85.00 per cent in 2010-11.
Transperth Ferry Services

The indicator reached 99.19 per cent, above the 2009-10 result of 98.39 per cent and above the target of 98.00 per cent in 2010-11. This is an increase of 0.81 per cent from 2009-10 and 1.21 per cent above the target.
Transwa Rail Services
Indicators of the ‘OTR’ performance for Transwa rail services are reported separately for each service.
a. Prospector

The indicator reached 75 per cent, above the 2009-10 result of 72 per cent and below the target of 90 per cent in 2010-11. This is an increase of 4.17 per cent from 2009-10 and 16.67 per cent below the target due to the disruption in services associated with speed restrictions, crossings, signal failures and track repairs.
b. Australind

The indicator reached 95 per cent, above the target of 90 per cent in 2010-11. This is 5.56 per cent above the target.
c. AvonLink

The indicator reached 98 per cent, above the target of 95 per cent in 2010-11. This is 3.16 per cent above the target.
d. MerredinLink

The indicator reached 92 per cent, above the 2009-10 result of 87 per cent and below the target of 95 per cent in 2010-11. This is an increase of 5.75 per cent from 2009-10 and 3.16 per cent below the target.
Transwa Road Coach Services

The indicator reached 98 per cent, above the 2009-10 result of 97 per cent and above the target of 95 per cent in 2010-11. This is an increase of 1.03 per cent from 2009-10 and 3.16 per cent above the target due to a review of timetables and stopping patterns.
Regional School Bus Services
This indicator measures school bus timetable reliability for rural mainstream services and Special Education School buses operating in the metropolitan area. The ‘OTR’ parameter is to arrive at school no less than 10 minutes before school starts and departing within 10 minutes of school ending.

The indicator reached 99.39 per cent, above the 2009-10 result of 97 per cent and above the target of 97 per cent in 2010-11. This is an increase of 2.46 per cent over 2009-10 and the target.
In 2010-11, 976 services were monitored for OTR of which 970 were within the time standard. The number of observations was within the acceptable limit of sampling error rate.
This indicator is calculated using a random sample which ties in with the SBS inspection program.
The table shows four year performance to 30 June 2011:
| Year | Number of observations for compliance with ‘on-time arrival’ | Observations that were compliant |
|---|---|---|
2007-08 |
1,046 | 1,022 |
2008-09 |
1,030 | 1,001 |
2009-10 |
888 | 864 |
2010-11 |
976 | 970 |
| The error rate of ± 3.05 per cent is within the ± 5 per cent tolerance level. | ||
4. Level of Overall Customer Satisfaction
The proportion of patrons who expressed overall satisfaction with their public transport service level, measures the public perception of the organisation’s performance in providing a high-quality and attractive public transport service.
The measure for Transperth services is derived from an extensive annual survey conducted by independent pollsters. The survey, known as the Passenger Satisfaction Monitor (PSM), provides an objective, unbiased view over time of patrons’ overall satisfaction with the system, e.g. safety, OTR, courtesy of staff, service frequency and station amenities. The information is used by Transperth to develop strategies for improving service performance and infrastructure.
The pollsters interview a large sample of passengers in lengthy face-to-face surveys. Interviewers are assigned to various services and transit station locations over a four week period covering the working week and weekend. This is the most comprehensive public transport survey of passengers in Australia.
Transperth Train Services
For the train PSM, a total of 1,012 train patrons were surveyed. The overall sample comprised of:
- Adults aged 18 years or over resident within the Perth metropolitan area;
- Current users of Transperth train services (excluding school students); and
- Patrons who travel on trains at least once per fortnight.
The sample error estimates were within ± 3 per cent - 4 per cent at the 95 per cent confidence level.

The indicator reached 88 per cent, below the 2009-10 result of 93 per cent and below the target of 90 per cent in 2010-11. This is a decrease of 5.38 per cent from 2009-10 and 2.22 per cent below the target.
The expressed levels of dissatisfaction increased from 3 per cent in 2009-10 to 5 per cent in 2011.
The results have been driven by a decrease of 8.70 per cent in overall satisfaction levels of peak-time travellers (from 92 per cent in 2009-10 to 84 per cent in 2010-11).
Overall satisfaction with off-peak weekday service frequency decreased by 2.38 per cent from 84 per cent in 2009-10 to 82 per cent in 2010-11.
The main reasons for dissatisfaction related to crowding issues, insufficient carriages and service frequency during peak times, service reliability and the high number of express services.
Transperth Bus Services
For the Transperth bus PSM, a total of 3,064 bus patrons were surveyed. The overall sample comprised of:
- Adults aged 18 years or over resident within the Perth Bus Contract region;
- Current users of Transperth bus services (excluding school students); and
- Patrons who travel on bus at least once per fortnight.
The sample error estimates were within ± 2 per cent - 3 per cent at the 95 per cent confidence level.

The indicator reached 82 per cent, above the 2009-10 result of 81 per cent and below the target of 83 per cent in 2010-11. This is an increase of 1.23 per cent from 2009-10 and 1.20 per cent below the target.
Levels of dissatisfaction remained unchanged at 10 per cent. The 2010-11 results are consistent with those of the past decade.
Marmion/Wanneroo/Joondalup, Belmont and all CAT services recorded significantly higher satisfaction levels in 2010-11 ranging from 86 per cent to 97 per cent. Significantly lower satisfaction and higher dissatisfaction levels were recorded for Morley and the Circle Route. However, both Morley and the Joondalup CAT services achieved significant improvements in overall satisfaction and reduction in dissatisfaction in 2010-11 compared to 2009-10.
The most frequently nominated reasons for dissatisfaction with the Bus system in 2010-11 were issues relating to service frequency, punctuality and insufficient off-peak and weekend services.
Transperth Ferry Services
For the Transperth ferry PSM, a total of 199 ferry patrons were surveyed. The overall sample comprised of:
- Adults aged 18 years or over resident within the Perth metropolitan area, (i.e. Patrons who were users of Transperth Ferry services and used it more than once a fortnight for Perth residents)
- Patrons who were users of Transperth Ferry services whilst visiting Perth.
- School students were excluded from the sample.
The sample error estimates were within ± 10 per cent at the 95 per cent confidence level.

The indicator reached 96 per cent, below the target of 98 per cent in 2010-11. This is 2.04 per cent below the target.
Customer satisfaction with the overall level of Transperth ferry services remained high at 96 per cent with no change from the previous two years. In 2010-11, only 1 per cent of the respondents indicated that they were dissatisfied at the overall service level thus maintaining the long-term trend of minimal dissatisfaction with Transperth ferry services.
Ferry users recorded high levels of satisfaction for all service characteristics. The key factors affecting the level of satisfaction were peak time service frequency, cleanliness on board, punctuality, personal safety, access to cash ticket purchase facilities and cost of fares.
Transwa Train and Road Coach Services
An independent passenger satisfaction survey is undertaken annually for each service: Australind, Prospector, AvonLink, MerredinLink and Road Coaches.
In 2010-11, a total of 976 country services patrons were surveyed via a self-completion questionnaire.
The sample error estimates were within ± 3 per cent - 5 per cent at the 95 per cent confidence level.

The indicator reached 90 per cent, 2.17 per cent below the target of 92 per cent in 2010-11.
Australind, Prospector and Road Coaches recorded high levels of satisfaction in 2010-11.
5. Customer Perception of Safety
Safety perceptions are an important factor in the public deciding whether to use public transport. The PTA is continuing to invest in security-related infrastructure and has increased its security staff to ensure that customers can see the tangible measures being taken to increase their safety.
Customer perceptions of safety are measured through data gathered in the PSM which distinguishes between on-train and on-bus and at stations, at night and during the day for the Transperth train and bus services.
Transperth Train Services

The indicator for safety at train stations reached 99 per cent, above the 2009-10 result of 98 per cent and above the target of 96 per cent in 2010-11. This is an increase of 1.02 per cent from 2009-10 and 3.13 per cent above the target.
The indicator for safety on-board trains reached 98 per cent, above the target of 97 per cent in 2010-11. This is 1.03 per cent above the target.

The indicator for safety at train stations reached 72 per cent, above the 2009-10 result of 70 per cent and above the target of 65 per cent in 2010-11. This is an increase of 2.86 per cent from 2009-10 and 10.77 per cent above the target.
The indicator for safety on-board trains reached 76 per cent, above the 2009-10 result of 75 per cent and above the target of 75 per cent in 2010-11. This is an increase of 1.33 per cent from 2009-10 and the target.
Transperth Bus Services

The indicator for safety at bus stations reached 97 per cent, above the 2009-10 result of 96 per cent. This is an increase of 1.04 per cent from 2009-10.
The indicator for safety on-board buses reached 99 per cent, above the 2009-10 result of 98 per cent and above the target of 98 per cent in 2010-11. This is an increase of 1.02 per cent over 2009-10 and the target.

The indicator for safety at bus stations reached 73 per cent, above the 2009-10 result of 70 per cent and above the target of 68 per cent in 2010-11. This is an increase of 4.29 per cent from 2009-10 and 7.35 per cent above the target.
The indicator for safety on-board buses reached 82 per cent, above the 2009-10 result of 79 per cent. This is an increase of 3.80 per cent from 2009-10.
6. Level of Notifiable Occurrences
Rail Safety
Railway safety incidents are recorded and notified to the Office of Rail Safety (ORS). These incidents are termed ‘notifiable occurrences’ and are defined in the Rail Safety Regulations 2011 as Category ‘A’ (serious injury, death, or significant damage) or Category ‘B’ (incidents that may have the potential to cause a serious accident). Notifiable occurrences reporting is a legislated requirement under the Rail Safety Act 2010 for the accredited owner and operator of a rail system and therefore form part of the PTA’s safety management system. These arrangements do not cover bus operations.
The performance measure for Category ‘A’ and ‘B’ occurrences is expressed as the number of occurrences per million passenger boardings and per million train kilometres. A low rate of incidents indicates that sound safety procedures and risk management procedures/controls exist and are operating effectively throughout the rail system.
The benchmark values for Category ‘A’ and Category ‘B’ incidents are calculated on the projected estimations of the number of future passenger boardings and train kilometres.

The indicator for Category ‘A’ occurrences per million passenger boardings reached 0.19, below the 2009-10 result of 0.23 and below the target of 0.25 in 2010-11. This is a decrease of 19.08 per cent from 2009-10 and 25.55 per cent below the target. The KPIs were calculated based on 11 Category ‘A’ occurrences, total train kilometres of 15.880 million and 59.101 million boardings in 2010-11.
The indicator for Category ‘A’ occurrences per million train kilometres reached 0.69, below the 2009-10 result of 0.86 and below the target of 0.90 in 2010-11. This is a decrease of 19.45 per cent from 2009-10 and 23.03 per cent below the target.
Category ‘A’ occurrences, which includes suicides, fell by 15.38 per cent from 13 in 2009-10 to 11 in 2010-11.
However, when excluding suicides and attempted suicides, there were 3 Category ‘A’ occurrences compared to 6 in 2009-10.

The indicator for Category ‘B’ occurrences per million passenger boardings reached 6.63, below the 2009-10 result of 8.19 and below the target of 9.00 in 2010-11. This is a decrease of 19.02 per cent from 2009-10 and 26.30 per cent below the target. There were 392 Category ‘B’ occurrences in 2010-11 compared to 464 in 2009-10.
The indicator for Category ‘B’ occurrences per million train kilometres reached 24.69, below the 2009-10 result of 30.74 and below the target of 32.80 in 2010-11. This is a decrease of 19.70 per cent from 2009-10 and 24.74 per cent below the target.
This is attributed to the effective Safety Management Systems controls in place and ongoing reviews of Transperth Train Operations.
Regional School Bus Services Safety
Accidents attributable to all causes are notified to the School Bus Team Leader Vehicle Inspector in the PTA. The measure for the notifiable occurrences is expressed as the number of accidents (major and minor) reported during the school year.
A low number of occurrences indicate that effective safety management procedures and controls exist and are being adhered to by school bus contractors and drivers throughout the regional school bus fleet.
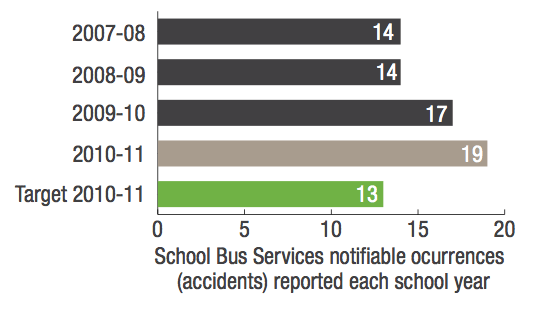
The indicator reached 19, above the 2009-10 result of 17 and above the target of 13 in 2010-11. This is an increase of 11.76 per cent from 2009-10 and 46.15 per cent above the target.
Overall, there were 19 ‘on-road’ school bus accidents in 2010-11, comprising 9 major and 10 minor accidents. Of the accidents, 68.42 per cent occurred through no fault of the school bus driver. No fatalities or serious injuries were recorded.
Of the 19 accidents, 14 occurred in the country area and 5 in metropolitan Perth.
As part of an ongoing campaign to educate school bus contractors and drivers about the relative risks associated with accidents, measures such as the implementation of the Safety Management plan for each SBS are an effective means of improving and maintaining safety standards. This action is expected to assist in reducing the number of notifiable occurrences.
Efficiency Indicators
The PTA’s effectiveness in providing a cost efficient public transport system is measured using the following key efficiency indicators:
- Average cost per passenger kilometre
- Average cost per 1,000 place kilometres
- Average cost per contracted kilometre
1. Average Cost per Passenger Kilometre
This indicator measures the cost efficiency of providing passenger services, expressed as the cost of carrying one passenger one kilometre.
Transperth
Passenger kilometres are calculated by multiplying the number of total boardings by the average trip length.
The indicator measures the cost efficiency of the services, i.e. the trend in the cost of carrying one passenger over one kilometre. A declining trend indicates that the resources used to provide the services are being utilised in a cost efficient manner.
Transperth Train Services

The indicator reached $0.40, below the 2009-10 result of $0.41 and below the target of $0.43 in 2010-11. This is a decrease of 2.27 per cent from 2009-10 and below the target result of 6.81 per cent indicating improving cost effectiveness.
The target was based on the projected passenger kilometres of 890.949 million and the budgeted total costs of $379.312 million. While total costs for the year were marginally (0.04 per cent) below the budget, passenger kilometres increased by 5.68 per cent to 946.283 million from 895.387 million in 2009-10.
Transperth Bus Services

The indicator reached $0.83, above the 2009-10 result of $0.76 and above the target of $0.81 in 2010-11. This is an increase of 9.65 per cent from 2009-10 and 2.88 per cent above the target.
The target was based on the projected passenger kilometres of 420.359 million and the budgeted total costs of $340.852 million. During the year, total costs rose by 10.36 per cent compared to 2009-10 and were 3.23 per cent above the target. This was mainly due to contract price escalation, fuel price increases, increased bus refurbishment costs and increased services for the Perth CAT and Ellenbrook services.
Passenger kilometres also increased by 0.82 per cent to 422.251 million from 418.835 million in 2009-10.
Transperth Ferry Services

The indicator reached $1.147, below the 2009-10 result of $1.22 and below the target of $1.15 in 2010-11. This is a decrease of 5.97 per cent from 2009-10 and 0.25 per cent below the target.
The target was based on projected passenger kilometres of 675,000 and budgeted total costs of $0.773 million. In 2010-11, passenger kilometre recorded a 1.55 per cent increase from 640,492 in 2009-10 to 650,446 but was 3.64 per cent below the target of 675,000. Total costs decreased by 4.72 per cent from $0.783 million in 2009-10 to $0.746 million in 2010-11 and were 3.47 per cent below the target of $0.773 million.
Transwa Rail Services

The indicator reached $0.43, below the 2009-10 result of $0.44 and below the target of $0.48 in 2010-11. This is a decrease of 3.22 per cent from 2009-10 and 11.12 per cent below the target due to a marginal (0.41 per cent) increase in passenger kilometres from 71.923 million in 2009-10 to 72.215 million in 2010-11 and a 2.83 per cent decrease in total costs. The 2010-11 result was lower than the target mainly due to the lower operating expenses compared to targets.
Transwa Road Coach Services

The indicator reached $0.22, above the 2009-10 result of $0.20 and below the target of $0.24 in 2010-11. This is an increase of 10.95 per cent from 2009-10 and 8.90 per cent below the target.
The 2010-11 result was higher than the previous year’s result due to a 10.66 per cent increase in total costs and a marginal decrease in passenger kilometres from 67.207 million in 2009-10 to 67.034 million in 2010-11.
2. Average Cost per 1000 Place Kilometres
This indicator measures the cost efficiency of providing the service per 1000 place kilometres and it is calculated for each mode by dividing total cost by place kilometres and multiplying by 1,000. Place kilometres are calculated by multiplying the average fleet capacity by the service kilometres.
Regional Bus Services
Intra-Town and Inter-Town Services

The indicator reached $80.91, above the 2009-10 result of $80.09 and above the target of $78.33 in 2010-11. This is an increase of 1.02 per cent from 2009-10 and 3.29 per cent above the target.
The target was exceeded due to the additional maintenance costs incurred by intra-town services and the costs associated with the reinstatement of the Kalbarri and Monkey Mia feeder services.
When compared to 2009-10, total passenger place kilometres for intra-town and inter-town services recorded a 0.17 per cent increase from 190.547 million to 190.874 million in 2010-11 while total cost increased to $15.443 million in 2010-11. Service kilometres also increased from 2.803 million kilometres in 2009-10 to 2.843 million in 2010-11. As a result, the indicator for 2010-11 was higher than the 2009-10 result.
Total Passenger Place Kilometres (millions)
This indicator measures the total number of passengers that can be carried for the service kilometres.
It is calculated for each mode of transport by multiplying the average fleet capacity by the service kilometres and this represents the capacity provided on each mode.
The service kilometres for most intra-town services are calculated using the Transperth Route Information System (TRIS).
Regional Bus Services
Intra-Town and Inter-Town Services
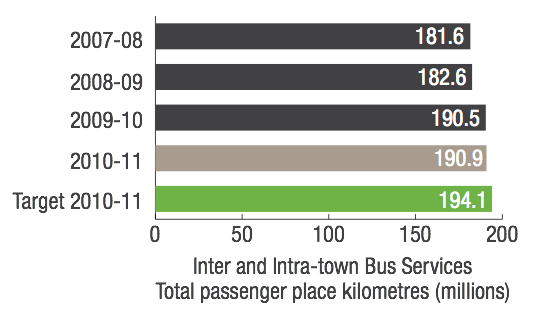
The indicator reached 190.9, above the 2009-10 result of 190.5 and below the target of 194.1 in 2010-11. This is an increase of 0.20 per cent from 2009-10 and 1.66 per cent below the target. Services kilometres increased by 1.44 per cent from 2.803 million in 2009-10 to 2.843 million in 2010-11.
3. Average Cost per Contracted Kilometre
Note: This efficiency indicator was not audited in the previous year 2008-09.
Regional School Bus Services
The cost of administering SBS on a kilometre basis.
It is calculated by dividing the total cost of school bus contracts and operating expenses by the total contracted kilometres.

The indicator reached $3.39, above the 2009-10 result of $3.27 and below the target of $3.56 in 2010-11. This is an increase of 3.74 per cent from 2009-10 and 4.66 per cent below the target. Delays in awarding the air conditioning retrofit contract have meant that the full cost of this program have not been incurred in 2010-11.
During the year, total costs and contract kilometres increased by 5.95 per cent and 2.13 per cent respectively when compared to 2009-10.
Outcome 2: Protection of the long-term functionality of the rail corridor and railway infrastructure
Effectiveness Indicator
The most significant issue for this outcome is the management of the long-term lease of the rail freight infrastructure to WestNet Rail Pty Ltd (now Brookfield Rail Pty Ltd).
WestNet Rail manages and operates the rail freight infrastructure under the terms of the Railway Infrastructure Lease. Under the Lease, WestNet Rail is the ‘accredited owner’ of the infrastructure as defined in the Rail Safety Act 1998.
Under the terms and conditions of the Railway Infrastructure Lease, an independent inspection of the railway infrastructure is carried out every five years. The second independent inspection was completed in June 2010.
The results of this inspection did not indicate any cause for concern and confirmed that the rail corridor and infrastructure was being satisfactorily maintained.
Cost Efficiency
The cost efficiency for the management of the long-term lease of the rail freight infrastructure to WestNet Rail is monitored using the total cost of managing the rail corridor and residual freight issues.
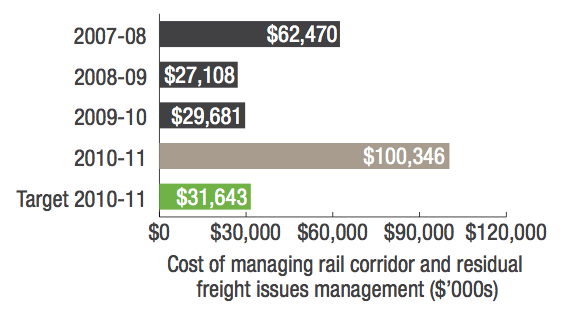
The cost of managing the rail corridor and residual freight issues in 2010-11 was significantly higher than the target and the previous year’s result following the revaluation of the freight network which increased depreciation costs significantly by $76 million.