|
Objective
measures of effectiveness and efficiency have been developed
and applied to ensure that management is able to identify
and respond to variations in the performance measures. The
measures, shown below for each of the PTA’s outputs,
are regularly reported and reviewed by the PTA’s Executive.
Several of these are Key Performance Indicators and are reviewed
annually by the Office of the Auditor General. The Key Performance
Indicators have been reported separately in the section “Audited
Key Performance Indicators”.
Output
1: Metropolitan and regional passenger services
top
of page
Provision
of customer-focused, safe and cost-effective passenger transport
to the metropolitan area and regional towns.
Summary
of the outcomes and measures:
| Outcomes |
Measures |
| Use
of public transport |
- Passengers
per services kilometre(a)
- Total
passenger place kilometres
|
| A
high safety standard is continuously achieved |
- Notifiable
occurrences(a)
- Lost-time
injury frequency rate
|
| Customers
are satisfied with high-quality, efficient service |
- Customer
satisfaction index(a)
- Service
reliability(a)
- Customer
perception of safety(a)
|
| Cost-effective
service |
- Cost
per passenger kilometre(a)
- Cost
per 1000 place kilometres
|
(a)
These measures are included in the section "Audited Key
Performance Indicators".
Quantity
Total passenger place kilometres
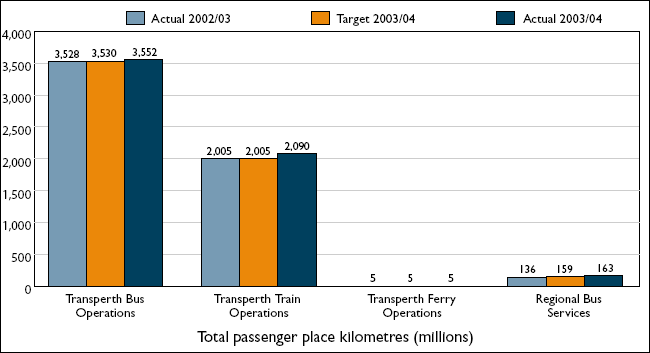
Transperth
Bus Operations: There was little change in both service
kilometres and bus fleet size, resulting in a relatively small
increase in place kilometres.
Transperth
Train Operations: The increase in train passenger
place kilometres was due to more four-car trains being operated
during the year which improved timetable efficiency and reduced
congestion.
Transperth
Ferry Operations: No significant variance.
Regional
Bus Services: The significant improvement was due
to budget responsibility for 11 public school bus services
being transferred to Regional Town Bus Services from School
Bus Services.
Quality
Lost-time injury frequency rate
The time lost as a result
of work injuries indicates how safe the working environment
is for staff and how effectively policies and procedures,
designed to ensure staff safety, are operating.The lost-time
injury frequency rate is a ratio based on the number of losttime
accidents multiplied by 1,000,000 divided by the total hours
worked for all employees.
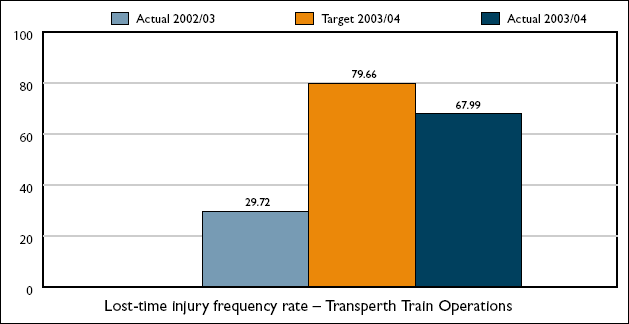
The
lost-time injury frequency rate increase in 2003/04 is the
result of change in staff composition of the workforce. This
composition has changed significantly with the employment
of about 180 Transit Guards and has increased the injury-risk
profile of the organisation.
New
procedures and further training have been introduced to rectify
the situation and a peer-support program has been introduced
to assist employees to cope with stressful situations. Psychometric
testing is now included in the selection process of Transit
Guards to assist in determining a person's suitability for
the position.The benefits of these procedures are reflected
in achieving a result less than the target.
Cost
(Efficiency)
Cost per 1000 place kilometres
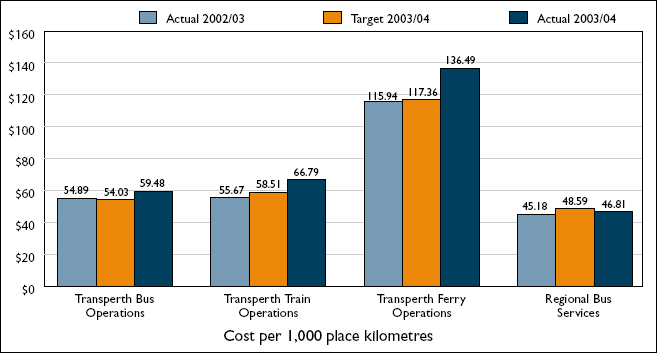
Transperth
Bus Operations: The variance is due to the increase
in depreciation following the revaluation of assets and the
reallocation of the capital user charge levy.
Transperth
Train Operations: The variance is due to the increase
in depreciation following the revaluation of assets and the
reallocation of the capital user charge levy.
Transperth
Ferry Operations: The variance is due to the significant
increase in depreciation following the revaluation of assets
and the application of the capital user charge levy.
Regional
Bus Services: An increase in place kilometres helped
to maintain a similar performance to 2002/03.
Ouput
2: Country passenger rail and road coach services
top
of page
Provision
of customer-focused, safe and cost-effective passenger transport
to regional communities.
Summary
of the outcomes and measures:
| Outcomes |
Measures |
| Use
of public transport |
- Passengers
per service kilometres(a)
- Total
passenger place kilometres
|
Customers
are satisfied with high-quality,
efficient service |
- Customer
satisfaction index(a)
- Service
reliability(a)
|
| Cost-effective
service |
- Cost
per passenger kilometre(a)
- Cost
per 1000 place kilometre
|
(a)
These measures are included in the section "Audited Key
Performance Indicators"
Quantity
Total passenger place kilometres
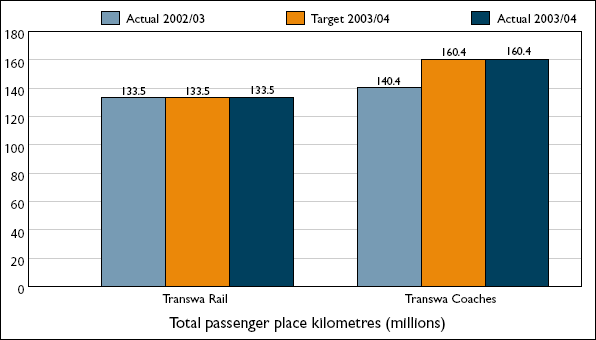
The coach
place kilometres increase was due to the increase seating
caacity of the new coach fleet.
Cost
(Efficiency)
Cost per 1000 place kilometres
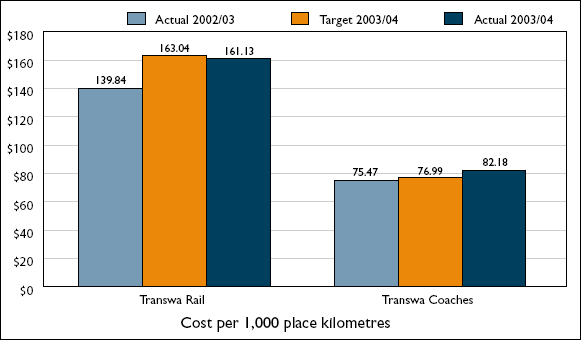
The increase
in cost compared to last year is largely attributable to an
increase in depreciation and interest costs associated with
capital expenditure on the new Prospector and the new coach
fleet.
Transwa
rail costs were slightly less than target because the new
Prospector service was delayed due to commissioning difficulties.
Output
3: Regional school bus services
top
of page
Provision of regional school bus transport to Western Australian
school students by the School Bus Services branch.
Summary
of the outcomes and measures:
| Outcomes |
Measures |
| Use
of school bus transport |
- Student
bus service passenger place kilometres
|
Customers
are satisfied with high-quality,
efficient service |
- Safety
level of notifiable incidents(a)
- Service
reliability(a)
|
| Cost-effective
service |
- Cost
per student place kilometre(a)
|
(a)
These measures are included in the section "Audited Key
Performance Indicators"
Quantity
Student
bus service passenger place kilometres
The increase in the use of regional school bus services is
measured by comparing the annual number of student bus service
passenger place kilometres.
A student
bus service passenger place kilometre is based on capacity
of the bus multiplied by the distance travelled (this includes
both loaded and unloaded kilometres).
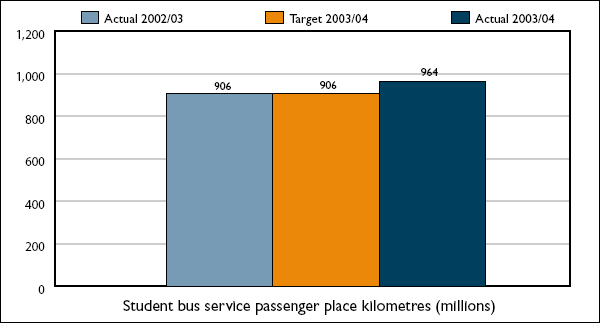
The increase
in 2003/04 is attributable to an increase in new services.
These services were required to meet demand for students attending
special education centres and mainstream schools. The demand
increased in areas such as Rockingham/Warnbro, Bullsbrook
and Kalamunda/Forrestfield.
Output
4: Rail
corridor and residual freight issues management
top
of page
Managing the rail freight corridor and infrastructure
leased to the private sector and associated freight transport
issues.
| Indicators |
2002/03
Actual
|
2003/04
Target
|
2003/04
Actual
|
Reason
for
significant variation
between 2003/04
Target and Actual
|
|
Quantity
Rail corridor and residual freight issues management
Quality(a)
Timelines(a)
Cost
(Efficiency)
|
1 program
N/A
N/A
|
1 program
N/A
N/A
|
1 program
N/A
N/A
|
Cost-efficiency indicator is included in the section
"Audited Key Performance Indicators"
|
(a)
Under the terms and conditions of the Railway Infrastructure
Lease, an independent inspection of the railway infrastructure
is carried out every five years.
|