

Audited Key Performances Indicators
To make its contribution to the Government’s goal ‘To enhance the quality of life and wellbeing of all people throughout Western Australia’, the PTA has adopted two outcomes:
- Accessible, reliable and safe public transport system
- Protection of the long-term functionality of the rail corridor and railway infrastructure
It aims to achieve the first of these outcomes through the:
- Metropolitan and Regional Passenger Services – these include
- Perth Metropolitan Train, Bus and Ferry Services of Transperth and
- Regional Town Bus Services;
- Country Passenger Rail and Road Coach Services of Transwa; and
- Regional School Bus Services.
The indicators of success in running these services are based on the use of public transport, accessibility, reliability, customer satisfaction, safety and cost effectiveness.
The PTA aims to achieve the second outcome - protection of the long-term functionality of the freight rail corridor and railway infrastructure - through its quality management of the rail corridor and residual issues for the rail freight operations which were leased to private sector operators in 2000.
Links to the Government Strategic Goal
The links to the Government Strategic Goal are presented in the table below:
MEASURING PERFORMANCE
Outcome: Accessible, reliable and safe public transport system
EFFECTIVENESS INDICATORS
The PTA’s outcome of an accessible, reliable and safe public transport system is achieved through the provision of the following services:
- Perth metropolitan train, bus and ferry services of Transperth;
- Regional Town Bus Services;
- Country passenger train and road coach services of Transwa; and
- Regional School Bus Services
The PTA’s effectiveness in providing an accessible, reliable and safe public transport is measured using the following key effectiveness indicators:
- Use of Public Transport
- Accessible Public Transport
- Service Reliability
- Level of Overall Customer Satisfaction
- Customer Perception of Safety
- Level of Notifiable Safety Incidents
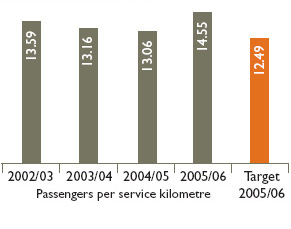
1. Use of Public Transport
The use of public transport is measured by comparing the annual number of passengers carried with the number of service kilometres. Service kilometres are kilometres operated on scheduled passenger services and excludes “dead running”, i.e. buses/trains travelling from the depot to commence a service trip, and travelling back after completing a service trip.
The measure indicates the extent to which services provided, as represented by the number of kilometres operated, are being utilised. An increasing trend in the indicator will generally signify that patronage is rising at a rate greater than the rate of increase in service kilometres operated and represents an improvement in effectiveness as well as an increase in the use of public transport.
This effectiveness indicator is applied to each mode of public transport. The indicator is based on total boardings on Transperth services and includes fare-paying boardings plus free travel and transfers. Transfers are boardings which occur either between services within the same mode or between modes during the specified free transfer time.
Transperth Bus Services

The results for 2005/06 were higher than the previous year’s actuals following an increase of 3.3% in total boardings compared to an increase of 1.2 % in service kilometres.
Transperth Train Services
The extension of the rail network to Thornlie in August 2005 resulted in service kilometres increasing by 13.6%, compared to the previous year actual. The target was set to take account of the increase in service kilometres, and an estimate of increasing patronage of the rail extension. Actual boardings increased by 4.5%, surpassing the targeted increase.
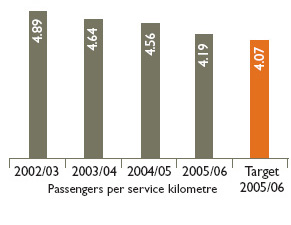
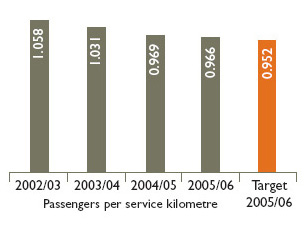
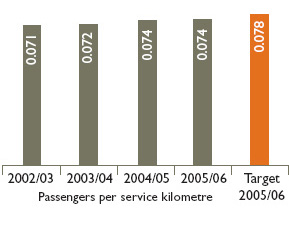
Regional Town Bus Services
The passengers per service kilometre have in the past years been reported as a single indicator for both intra-town and inter-town services. Intra-town services operate within rural town boundaries, while inter-town services run between regional centres.
In order to provide a more meaningful result in reporting on the performance of regional town bus services for 2005/06, the services have been split into intra-town and inter-town components.
a. Intra-Town Bus Services
For regional intra-town services, the result for 2005/06 slightly exceeded the target set for the year and was in line with the 2004/05 performance.
b. Inter-Town Bus Services
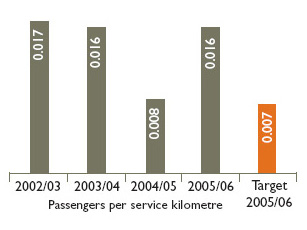
The result of 0.016 passenger per service kilometre was higher than the 2005/06 target. This was as a result of:
| a. | The target for 2005/06 did not include the Perth to Port Hedland road coach service because the future of this service was subject to successful trial; and | |
| b. | The target did not include the Roebourne youth bus service which was a new service introduced during the year. |
The 2004/05 actual passenger per service kilometre was only 0.008 primarily due to the performance of the Perth to Port Hedland road coach service during this year, carrying an average of only 0.006 passengers per service kilometre. This improved to an average of 0.011 passengers per service kilometre in 2005/06.
Transperth Ferry Services
2005/06 results were above target as a result of an increase of 9.1% (compared to the previous year) in ferry boardings, reversing the declining trend seen during the recent past.
The 2005/06 results were also affected by the decline in service kilometres which have fallen by 4.5% due to the service rationalisation introduced on 1 May 2005 when Coode Street services ceased.
The reallocation of resources to focus on the primary demand for services between Barrack Street and Mends Street has resulted in a significantly better performance compared to the previous three years.
Transwa Train Services

The 2005/06 results were higher compared to target and have been impacted by a reduction of 6.6% in service kilometres with a corresponding decrease of only 4.5% in boardings. The reduction in service kilometres and total boardings has been as a result of derailments of freight trains, track works and less services run by railcars due to mechanical problems with the new Prospector railcars.
Transwa Road Coach Services
2005/06 was below target following a reduction in total boardings of 2.4% (compared to the target), as a result of the flooding in Esperance and Lake Grace which resulted in Transwa being unable to operate services.
2. Accessible Public Transport
Accessibility to public transport, in terms of service coverage, is measured as the proportion of Point Street Addresses (PSAs) within the Perth Public Transport Area (PPTA) which are within 500 metres of a Transperth stop providing an acceptable level of service. PSAs’ data is obtained from the Department of Land Information (DLI) and defines the central part of a street address. The PPTA is the area where Transperth services operate and the frequency of services is on average 3 trips per hour or more in the peak direction, or where a Transperth bus runs catering for students.
“Acceptable level of service” is defined as an hourly service during the day with at least three trips per hour (i.e. at 20-minute intervals) in the peak flow direction in the morning and/or afternoon peaks.
The indicator uses PSAs data from DLI and service information and stop location data from the Transperth Route Information System (TRIS).
The measure demonstrates the extent to which the PTA meets its accessibility standards in the Perth metropolitan area.
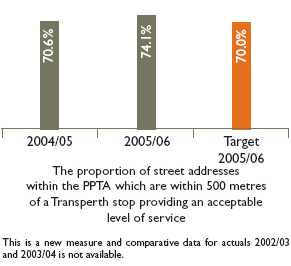
A significant increase has been recorded in 2005/06 in the proportion of PSAs within the PPTA which were less than 500 metres of an acceptable level of service stop. The improved result is due to a significant increase (13.5%) in the number of PSAs within the PPTA from 623,548 in March 2005 to 707,455 in March 2006. The number of stops remained unchanged.
The results demonstrate that the PTA meets its accessibility target in the Perth metropolitan area.
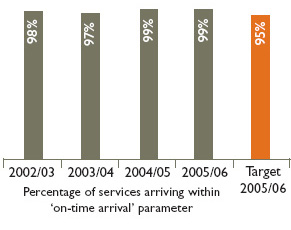
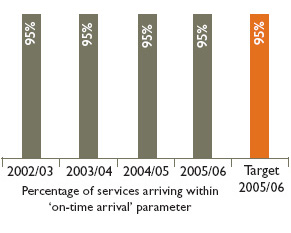
3. Service Reliability
According to an independent survey to measure customer satisfaction, service reliability is ranked as one of the most significant characteristics of a quality service. Service reliability is essentially a combination of two main factors, punctuality and consistency.
Services are considered to be punctual if they arrive within a limited period of time after the scheduled arrival time. These parameters referred to as ‘on-time arrival’ are shown in the table for each operation.
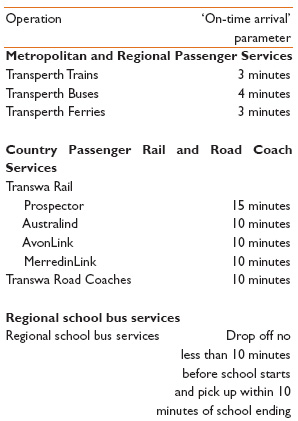
The ‘on-time arrival’ measure demonstrates the extent to which the PTA meets its service reliability standards.
Transperth Train Services
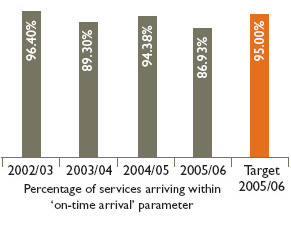
On-time running delays for the metropolitan train services were experienced as a result of:
- operational issues related to the Thornlie line commissioning;
- speed restrictions due to resleepering;
- line closures for the new works associated with the Southern Suburbs railway project; and
- line congestions.
Transperth Bus Services
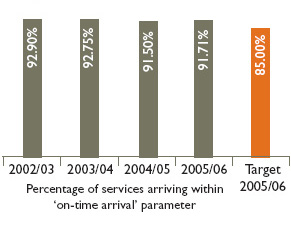
This KPI is calculated using a sample which ties in with Transperth’s internal monthly punctuality audit plan. The total number of observations made in the year 2005/06 was 21,064. The sample error estimate was within + or – 0.67% at 95% confidence level for Transperth Bus Services.
The general network of Transperth bus services performed at a high level of reliability consistent with previous years. The southern suburbs bus services succeeded in minimising the impact of construction works associated with the Southern Suburbs Railway on bus punctuality through improved traffic management schemes and timetable adjustments. As a result of these measures the actual result for 2005/06 was better than the target.
Transperth Ferry Service

The ‘on-time arrival’ parameter has been dropped for 2005/06 as the data provided in previous years has been based on estimates. Currently the ticketing system is used to confirm that the numbers of scheduled trips are actually performed.
Additionally it should be noted that the Passenger Satisfaction Monitor survey has revealed that patrons have expressed an extremely high level of satisfaction with ferry reliability.
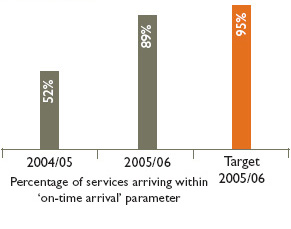
Transwa Rail Services
Indicators on the ‘on-time arrival’ for Transwa rail services have been reported separately for each of the different services run.
a. Prospector
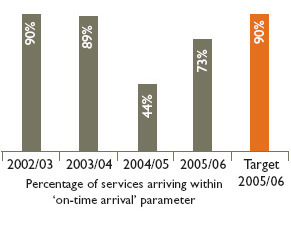
The improvement in the on-time running over 2004/05 are representative of improved reliability of the railcars as some major problems were overcome later in the year and continued improvement is expected in the future.
b. Australind
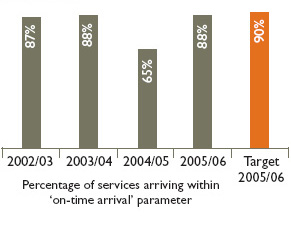
The target for 2005/06 could not be achieved as a result of:
- Resleepering of track between Brunswick and Picton by WestNet Rail. This section has now been completed; and
- Automatic signalling functionalities lost following the theft of signal wires by vandals resulted in the operation of manual controls. An upgraded signalling system which will prevent future problems of this nature being installed.
c. AvonLink
The 2005/06 results were better compared to the target due to the smooth running of the AvonLink throughout the year.
d. MerredinLink
This is a new service introduced in 2004/05, hence no comparative data.
The 2004/05 results were affected by the crossing of freight trains and mechanical problems with the new railcars.
Most of the problems were addressed in 2005/06.
Transwa Road Coach Services
Transwa road coach services on-time running has been consistent and in line with targets.
Regional School Bus Services
This KPI measures school bus timetable reliability for rural mainstream services and Special Education School Buses operating in the metropolitan area.
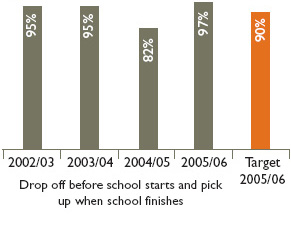
This KPI is calculated using a random sample which ties in with the inspection programme. The results are provided in the table below:
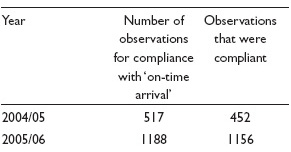
The sample error estimates was within + or – 2.8% at 95% confidence level for Regional School Bus Services.
The improvements are related to clearer standards in new contracts and stronger compliance.
4. Level of Overall Customer SatisfactionThe percentage of patrons who, overall, were satisfied with services, measures the public perception of the organisation’s performance in providing a high quality and attractive public transport service.
The measure for Transperth services is derived from an extensive annual survey conducted by independent consultants. The survey referred to as the ‘Passenger Satisfaction Monitor’ (PSM) provides an objective, unbiased view over time of patrons’ overall satisfaction with the system, e.g. safety, on-time running, courtesy of staff, service frequency and station amenities. The information is used by Transperth to develop strategies for improving service performance and infrastructure.
The independent consultants interview a large sample of passengers. Interviewers are assigned to various services and transit station locations over a four week period covering the working week and weekend. A questionnaire is used by the interviewer and respondents are asked to provide a wide range of responses regarding their views on public transport performance. This is a face-to-face interview and is the most comprehensive public transport survey of passengers/users in Australia.
Transperth Train Services
For the Transperth Train PSM 2006, a total of 799 rail patrons were surveyed. The overall sample comprised:
- Adults aged 18 years or over resident within the Perth metropolitan area;
- Current users of Transperth train services (excluding school students); and
- Patrons who travel on trains at least once per fortnight.
The sample error estimates were within + or –6% at 95% confidence level for Transperth Train Services.
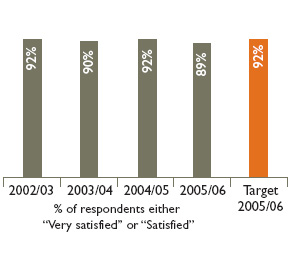
The 2006 survey results provided by the PSM reflect an overall reduction in the customer satisfaction index. The main drivers for this decline have been problems with the on-time performance of trains (see also section 3 for service reliability) and customer complaints about overcrowding during peak hours.
Transperth Bus Services
For the Transperth Bus PSM 2006, a total of 2,850 bus patrons were surveyed. The overall sample comprised:
- Adults aged 18 years or over resident within the Perth Bus Contract region;
- Current users of Transperth bus services (excluding school students); and
- Bus patrons who travel on the bus at least once per fortnight.
The sample error estimates were within + or – 2% to 3% at 95% confidence level for Transperth Bus Services.
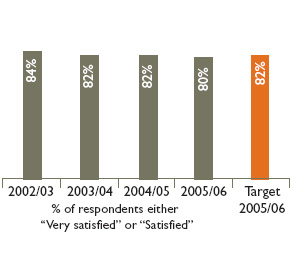
The 2006 PSM survey results show that customer satisfaction with the Transperth bus system overall declined marginally (not statistically significant) compared to 2004/05 and was below the 2005/06 target. Reasons for this reduction identified by the sampled patrons are:
| i. | A decline (from 75% to 72%) in the proportion of respondents who indicated fares to be excellent/good value. |
|
| ii. | A reduction (from 79% to 76%) in the level of overall satisfaction with the frequency of buses during peak times. |
Transperth Ferry Services
For the Transperth Ferry PSM 2006, a total of 200 ferry patrons were surveyed.
The overall sample comprised:
- Adults aged 18 years or over;
- Patrons who were users of the Transperth Ferry services and used it more than once a fortnight for Perth residents and whilst visiting for non-resident visitors to Perth. School children were excluded from this sample.
The sample error estimates were within + or – 10% at 95% confidence level for Transperth Ferry Services.
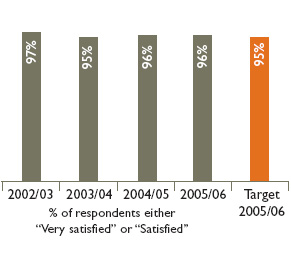
The 2006 PSM survey results show that high customer satisfaction targets have been achieved.
Transwa Train and Road Coach Services
An independent passenger satisfaction survey is undertaken for each service - Australind, Prospector, AvonLink, MerredinLink and Road Coaches.
For the Transwa rail and road coach PSM survey for 2006, a total of 874 country services patrons were surveyed via a self-completion survey.
The sample error estimates were within + or – 3% to 4% at a 95% confidence level.
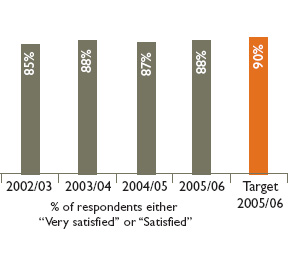
Overall passenger satisfaction remains very high at 88%, with 46% of passengers indicating they were “very satisfied” and a further 42% “satisfied”.
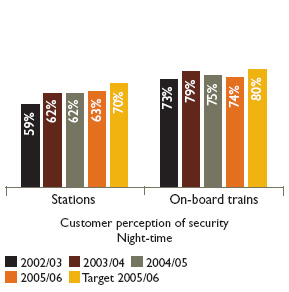
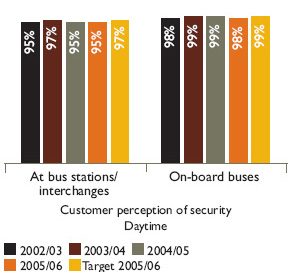
5. Customer Perception of SafetyHow safe customers feel on trains and buses and at stations is an important factor in deciding whether to use public transport. The PTA is continuing to invest capital funds in security-related infrastructure and has increased its security staff to ensure that customers can see the tangible measures being taken to increase their safety.
Customer perception of security is measured through data gathered in the Passenger Satisfaction Monitor (PSM) survey. The passenger satisfaction survey results provide an objective, unbiased view over time of patrons’ perceptions of security and distinguishes between on-train and on-bus and at stations, at night and during the day for the Transperth Train and Bus Services.
Transperth Train Services
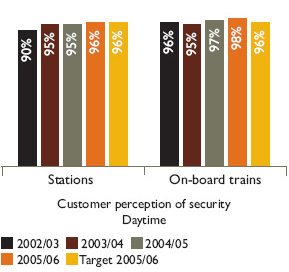
The report further stated that a high proportion of patrons acknowledged that Transperth is perceived to be taking action to address security concerns.
Transperth Bus Services
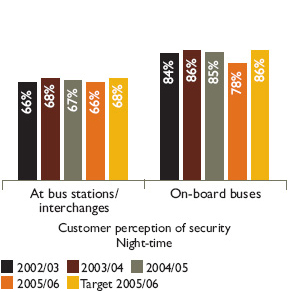
The night-time result for bus stations/interchanges was also slightly below target.
However, there was a significant reduction in the perception of safety on-board buses at night-time when 78% of respondents indicated they “always or usually feel safe” at this time compared to 85% in 2005. In 2005, 33% of respondents indicated they “always” feel safe, whereas this proportion fell to 23% in 2006.
Transperth has taken a number of measures to address the security concerns. Details of the measures are included under passenger safety in the Transperth section of this report.
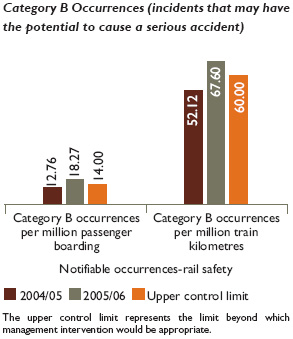
6. Level of Notifiable OccurrencesRail Safety
Railway safety incidents are recorded and notified to the Office of Rail Safety. These incidents are termed notifiable occurrences and are defined in the Rail Safety Regulations 1999 as Category A (serious injury, death, or significant damage) or Category B (incidents that may have the potential to cause a serious accident) and Australian Standard “Railway Safety Management” 4292 - 2006. Notifiable occurrences are a legislative requirement under the Rail Safety Act 1998 for the accredited owner and operator of a rail system and therefore form part of the organisation’s safety management system. These do not cover bus operations.
The performance measure for Category A and B occurrences is expressed as the number of occurrences per million passenger boardings and per million train kilometres. A low level of incidents indicates that sound safety procedures and controls exist and are operating effectively throughout the rail system.
Under direction of General Manager Rail Safety, Department for Planning and Infrastructure, the PTA adopted national reporting definitions for notifiable occurrences effective 1 January 2005. In January 2006 the General Manager issued further instructions to implement changes to AS 4292 including definitions for notifiable occurrences.
The results below do not include the comparatives for 2002/03 and 2003/04 as the data would not be comparable due to the change in reporting definitions.
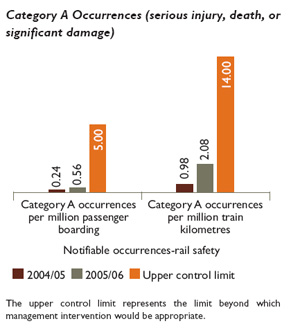
The results for the Category A occurrences continue to be at a low level as a result of increased risk management initiatives and controls.
The results for 2005/06 were above the upper control limit and can be attributed to the high level of new project work being carried out on the operating railway.
Regional School Bus Services Safety
Accidents attributable to all causes are notified to and recorded by the School Bus Team Leader Vehicle Inspector. The performance measure for the notifiable occurrences are expressed as the number of notifiable occurrences (accidents) reported during the school year. A low level of incidents indicates that sound safety procedures and controls exist and are being adhered to throughout the regional school bus fleet.
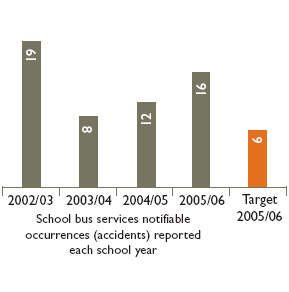
There were 16 ‘on-road’ recorded school bus accidents in 2005/06 comprising 11 minor and 5 major accidents.
Approximately 81% of the accident cases occurred through no fault of the school bus driver. As part of an ongoing campaign to educate school bus contractors about the relative risks associated with accidents, measures such as the rollout of the Safety Management plan is an effective means of improving safety.
This action is expected to assist in lowering the number of notifiable occurrences.
EFFICIENCY INDICATORS
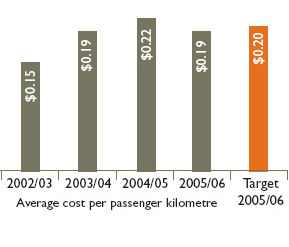
Cost per Passenger Kilometre
The cost per passenger kilometre measures the cost efficiency of providing passenger services, expressed as the cost of carrying one passenger one kilometre.
Passenger kilometres are currently based on the zonal distribution of passenger trips and an assumed average trip length for each zone. Ideally, the average passenger trip length on each mode should be determined more accurately, through a survey, and multiplied by the number of trips on that mode to calculate passenger kilometres.
The indicator measures the cost efficiency of the services, i.e. the trend in the cost of carrying one passenger over one kilometre. A declining trend indicates that the resources used to provide the services are being utilised in a cost efficient manner.
Transperth Train Services
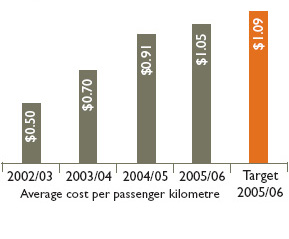
The 2005/06 average cost was below the target. This was due to:
a. An increase in passenger kilometres resulting from higher patronage; and
b. Lower than budgeted borrowing costs.
Compared to prior years the 2005/06 actuals are higher due to increased capital charges which include borrowing costs, depreciation and capital user charges as a result of the expanded train network.
Transperth Bus Services
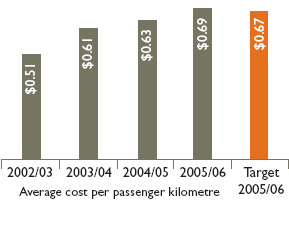
The 2005/06 cost was higher than the target due to cost pressures. Total expenditure increased 11.7% while passenger kilometres recorded an increase of only 2.1%.
The increase in total expenditure was due to:
- Higher contract costs due to fuel and wages increases;
- Increased security costs for security patrols and closed circuit television systems;
- Increased marketing costs following public awareness campaigns in particular security e.g. “See Something Say Something”, SmartRider; and
- Costs incurred in relation to connection of natural gas supplies at various depots.
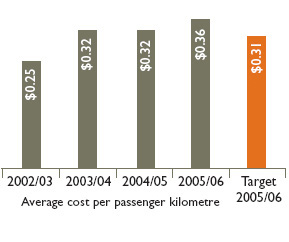
Transperth Ferry Services
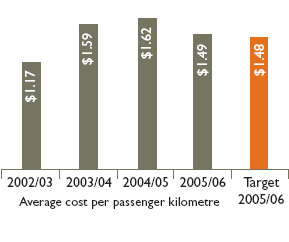
Transwa Rail Services
- Change in internal operating cost allocation between Transwa rail and road services which was finalised after targets were set; and
- Lower passenger kilometres compared to the estimate due to mechanical problems with the Prospector railcars.
Transwa Road Coach Services
Regional School Bus Services
The cost efficiency measure for school bus services measures the cost of funding student place kilometres provided to meet student requirements.
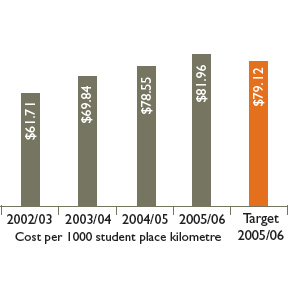
The results for 2005/06 did not meet the target due to an increase in financial commitments resulting from the actual number of contracted service days being higher than the budget estimate.
Outcome: Protection of the long term functionality of the rail corridor and railway infrastructure
EFFECTIVENESS INDICATOR
The most significant issue for this outcome is the management of the long term lease of the rail freight infrastructure to WestNet Rail Pty Ltd.
WestNet Rail manages and operates the rail freight infrastructure under the terms of the Railway Infrastructure Lease. Under the Lease, WestNet Rail is the ‘accredited owner’ of the infrastructure as defined in the Rail Safety Act 1998. WestNet Rail’s holding company Australian Railroad Group was acquired during the year by a Babcock and Brown Company. WestNet Rail retains all of its legal responsibilities under the lease agreement.
Under the terms and conditions of the Railway Infrastructure Lease, an independent inspection of the railway infrastructure is carried out every five years. The first independent inspection was completed in June 2005.
The results of this inspection did not indicate any cause for concern and that the rail corridor and infrastructure is being satisfactorily maintained.
COST EFFICIENCY
The cost efficiency for the management of the long term lease of the rail freight infrastructure to WestNet Rail, is monitored using the total cost of managing the rail corridor and residual freight issues.
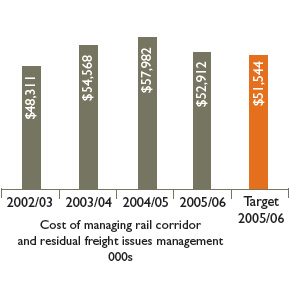
Compared to 2004/05 the total costs in 2005/06 have dropped as a result of the settlement of a claim of $4.55M related to a disputed contract in 2004/05.
>> Go to top