

Review of Performance
Trains
Description of Services
Transperth Train Operations (TTO) Division of the PTA operates an electrified suburban train system with more than 890 services on an average weekday and in excess of 5,600 services weekly.
At 30 June 2006, the system covered 101.7 kilometres of track with 59 stations on five lines, and a fleet of 186 railcars which can be coupled in configurations of two, three, four or six car trains.
The train network consists of the Joondalup Line (33.2km), the Fremantle Line (19.0km), the Midland Line (16.0km), the Armadale Line (30.5km) and the Thornlie Line (3.0km).
The Year’s Developments
An additional 36 railcars were added to the Transperth fleet. These railcars, together with the 54 acquired in the previous year, are to be used mainly on the Southern Suburbs Railway. During the year, all 90 railcars in configurations of three and six railcar trains were used on existing lines.
With the extension of the train network and consequent increase in services, train service kilo-metres increased by 13.6 per cent, from 7.167 million in 2004/05 to 8.138 million in 2005/06. The use of three and six railcar trains during the year resulted in passenger place kilometres recording an increase of 23.1 per cent, from 2,293.6 million to 2,823.3 million.
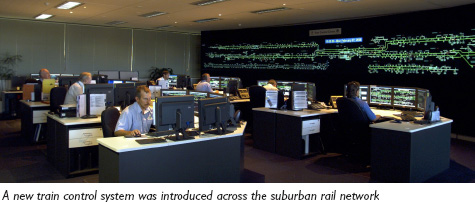
Between January and December 2005, a new suburban train control system was progressively introduced throughout the existing PTA urban rail network. The system incorporates new trackside telemetry which, in the near future, will deliver automatic route setting, integrated timetable planning and monitoring, comprehensive performance reporting, and new customer information displays at the stations.
 The train control system monitors daily train movements to determine the actual on-time arrival rate. The service reliability target for Transperth train services is for 95 per cent of services to arrive within three minutes of the scheduled time. In 2005/06, 86.9 per cent of services met the on-time arrival target compared with 94.4 in 2004/05. However, when service reliability is based on arrival within five minutes of the scheduled time, 95.4 per cent met the target in 2005/06 and 98.3 per cent in 2004/05.
The Urban Securities Initiative Project (USIP) was completed. It improves the safety of customers using the rail system through 622 closed circuit television cameras, a Central Monitoring Room where video data from the cameras is collected, viewed and stored, and emergency/information booths on stations.
Engineering works on the Armadale Line at Victoria Park, Cannington, Thornlie and Gosnells allowed level crossings to be closed at Bishopsgate Street, Crawford Street, Verna Street and Lake Road reducing the risk of level crossing incidents.
The replacement of timber sleepers with concrete sleepers began on the Armadale Line. Approximately 14km were completed and the remaining 16km are scheduled to be completed by March 2007.
A siding to accommodate six car trains was constructed at West Leederville to improve train movements and operational efficiency for special events at Subiaco Oval.
An upgrade of Cannington Station was carried out to make the station fully accessible.
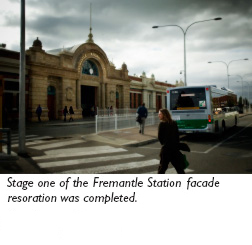
The first stage of restoration of the historic Fremantle Station façade was completed. This work was undertaken with the guidance of the Heritage Council and will see the entire building restored in time for the 125th anniversary of its opening and the opening of the Fremantle Line in the second half of 2006.
Cost of the Service
The total cost of providing train services increased by 37.9 per cent, due largely to the increase in capital charges. Total expenditure, which amounted to $190.2 million in 2004/05, rose to $262.3 million in 2005/06. Operating cost (which excludes capital charges) increased by 13.3 per cent from $93.9 million to $106.9 million.
A significant proportion of debt servicing charges included in the total expenditure relates to the Southern Suburbs Railway. Similarly, the operating cost included “ramp-up” expenditure on recruiting and training of train crews for the new railway. However, revenue was yet to be generated from this significant investment which will double Perth’s suburban rail network.
Patronage
Patronage on Transperth train services recorded a substantial increase for the second year in succession. Fare-paying boardings rose by 4.8 per cent from 20.038 million in 2004/05 to 21.002 million in 2005/06. Total boardings increased by 4.5 per cent from 32.652 million to 34.133 million.
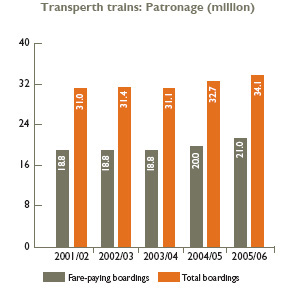
While train patronage recorded this significant increase, the expansion of services resulted in train service kilometres increasing at a higher rate, by 13.6 per cent. Consequently, between 2004/05 and 2005/06 on a per service kilometre basis, fare-paying boardings on train services fell by 7.7 per cent from 2.796 to 2.581, and total boardings fell by 7.9 per cent from 4.556 to 4.194.
Customer Satisfaction
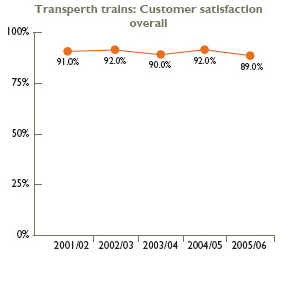
The Passenger Satisfaction Monitor 2006 showed that a significant proportion of users continued to show high levels of satisfaction with the train system overall although the proportion fell to 89 per cent from 92 per cent in 2005. The table below shows that the main contributing factors in the slight downturn were a significant reduction in the level of satisfaction with punctuality of trains and perceived overcrowding during peak times, in that order. Decreased punctuality was attributable to a program to lay new sleepers on the Armadale Line and some teething issues in the timetabling of services on the new Thornlie Line, which also affected the Armadale Line.
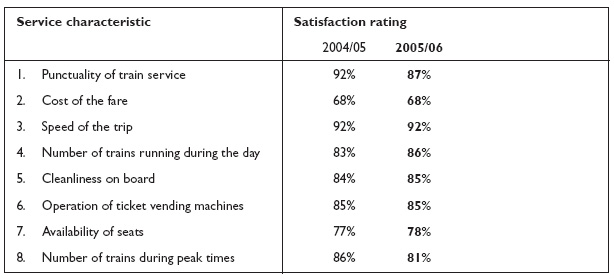
Satisfaction ratings for key service characteristics of Transperth’s train services (other than passenger safety) are shown above.
Passenger Safety
In the Passenger Satisfaction Monitor 2006, train users were asked: “How safe do you generally feel from personal interference or threat from other passengers?”
The graph shows the proportion of respondents who “always or usually feel safe” at the specified times/locations on the train network.
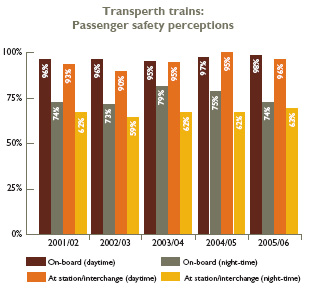
The results for the past five years show that the proportion of train passengers who felt generally safe on-board trains and at station/interchanges during the day has remained high. However, the proportion of train users who generally felt safe on-board trains at night continued to fall, from 79 per cent in 2004 to 75 per cent in 2005 and 74 per cent in 2006. The proportion of respondents who generally felt safe at station/interchanges at night-time improved marginally.
The PTA is committed to ensuring that passengers feel safe on the train network at all times. At year’s end, a total of 191 Transit Guards were in service and an additional 14 were in training.
In addition, the centralised monitoring of digital closed circuit TV coverage at all stations via a state-of-the-art monitoring centre manned 24 hours a day continued during the year.
A memorandum of understanding between the PTA and the Western Australian Police remained in force during the year. This memorandum established protocols for the provision of policing services and security arrangements on the suburban rail network aimed at reducing criminal and other anti-social behaviour on the network and ensuring personal safety and security for the commuting public.
Buses
Description of Services
Transperth bus services were operated by three contractors under 11 contracts in 2005/06:
- Path Transit (Marmion-Wanneroo and Morley contracts, with the Joondalup Central Area Transit contract forming part of the Morley contract).
- Swan Transit (Canning, Kalamunda, Midland, Southern River, Claremont, and Belmont contracts).
Southern Coast Transit (Rockingham, Fremantle-Cockburn, and Perth Central Area Transit contracts, with the Fremantle Central Area Transit contract forming part of the Fremantle-Cockburn contract).
The Claremont-Belmont contract, which was operated by Swan Transit Riverside, ceased on 10 December 2005. This contract was replaced by two separate contracts for Claremont and Belmont from 11 December 2005, both awarded to Swan Transit following a competitive tender process.
During 2005/06, the Transperth bus system covered 323 standard routes and 436 school routes, and operated 9,432 standard services and 436 school services on an average weekday. Accessible buses were always used on 38 of the standard routes. A service frequency of 20 minutes or better was provided all day on most major corridors.
The Year’s Developments
The following major service improvements were introduced during the year:
- A feeder bus network in August 2005 to support the new Thornlie train station.
- A feeder service to a new bus transfer facility at Ellenbrook.
- Improved service frequency on peak period feeder services to Clarkson Train Station and on peak services between East Perth and Hamilton Hill.
- Improved service frequency on off-peak services to Canning Vale, between Cannington and Midland.
- Improved service frequency on the Perth to Mandurah service.
- Improved service frequency on services to Settlers Hill, Curtin University, and Hammond Park.
- A new service to Banksia Grove.
Working with the City of Joondalup and Edith Cowan University, a new Central Area Transit (CAT) service was introduced at Joondalup. These partners share the cost of this new CAT route with the PTA.
A bus lane at South Street in Leeming came into service to provide peak period priority at a key point on this major east-west route.
A bus priority lane was created on Alexander Drive at the Walcott Street intersection in North Perth.
Transperth developed a network of conceptual feeder bus routes to support the Southern Suburbs Railway when it commences operations. Extensive community consultation was undertaken regarding this new network.
Total service kilometres operated by the Transperth bus network continued to increase. In 2005/06, the network covered 49.146 million service kilometres, an increase of 1.2 per cent from the 48.582 million service kilometres recorded in 2004/05, which was itself an increase of 1.4 per cent compared with the previous year.
Total capacity provided by the bus network was marginally higher in 2005/06 at 3,559.8 million passenger place kilometres, an increase of 0.4 per cent compared with 3,545.3 million passenger place kilometres in 2004/05. The small increase in 2005/06 occurred despite the increasing proportion of gas buses in the fleet which have a lower average passenger capacity compared with diesel buses. However, this was offset by the increase in service kilometres resulting in greater overall capacity being provided.
The service reliability target for Transperth bus services requires buses to arrive at or depart from a terminus or timing point no later than four minutes from the scheduled time. Performance is monitored through regular audits at key locations. In 2005/06, despite the continuing disruption to traffic flow caused by road works associated with the construction of the Southern Suburbs Railway, improved traffic management schemes and timetable adjustments helped to ensure that 91.7 per cent of services met the service reliability target. This result compared with 91.5% in 2004/05. During the period 2001/02 to 2003/04, before the road works commenced, the proportion of bus services meeting the reliability target was close to 93 per cent.
Cost of the Service
The total cost of providing bus services was $225.0 million in 2004/05, which increased to $251.2 million in 2005/06, an increase of 11.7 per cent due largely to the increase in operating costs. The operating cost (which excludes capital charges) recorded an increase of 14.3 per cent, from $171.3 million in 2004/05 to $195.8 million in 2005/06 primarily driven by significant increases in the cost of fuel, labour and security.
Patronage
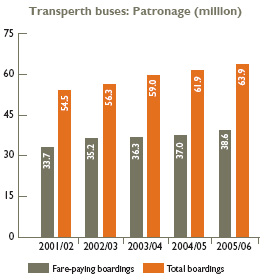
Transperth’s bus services experienced patronage growth for the seventh year in succession. In 2005/06, fare-paying boardings rose by 4.5 per cent from 37.0 million to 38.650 million and total boardings rose by 3.3 per cent from 61.873 million to 63.891 million.
Between 1998/99 (the first full year when all bus services were operated on contract) and 2005/06, bus patronage increased as follows:
- fare-paying boardings by 33.6 per cent from 28.929 million to 38.650 million, and
- total boardings by 43.1 per cent from 44.647 million to 63.891 million.
On a per service kilometre basis, fare-paying boardings on bus services increased by 3.3 per cent from 0.762 in 2004/05 to 0.786 in 2005/06, and total boardings increased by 2.1 per cent from 1.274 to 1.3.
Customer Satisfaction
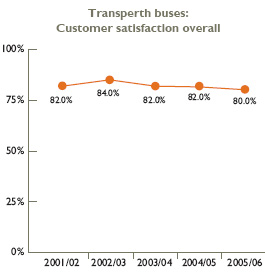
The Passenger Satisfaction Monitor 2006 showed that a relatively high proportion of users continued to be satisfied with the bus system overall. However, the proportion who expressed satisfaction fell from 82 per cent in 2005 to 80 per cent in 2006.
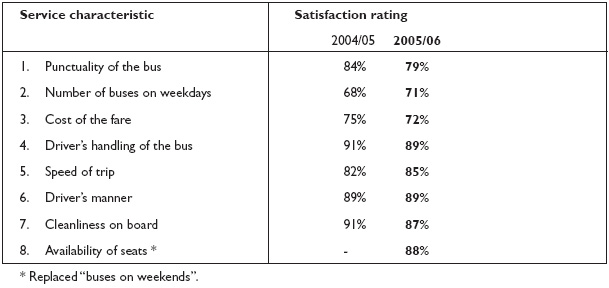
The table above shows that the main contributing factors to the adverse result were a significant level of dissatisfaction with punctuality of services and the cost of fares, in that order.
Satisfaction ratings for key service characteristics of Transperth’s bus services (other than passenger safety) are shown above.
Passenger Safety
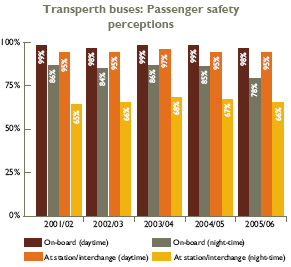
In the Passenger Satisfaction Monitor 2006, bus users were asked: “How safe do you generally feel from personal interference or threat from other passengers?”
The graph shows the proportion of respondents who “always or usually feel safe” at the specified times/locations on the bus system.
The results for the past five years show that almost all bus passengers generally felt safe on-board buses and at station/interchanges during the day. The proportion of respondents who generally felt safe at night at stations/interchanges has remained relatively stable. However, it is noteworthy that there has been a significant decline, from 85 per cent to 78 per cent, in the proportion of respondents who generally felt safe on-board buses at night.
Over recent years, Transperth has introduced the following measures to promote passenger safety on the bus network:
- Two security officers deployed Thursday to Saturday of each week at each major bus station from 2 pm to last bus.
- Mobile patrols on each of the three major sectors – north, south and east.
- Centrally monitored closed circuit TV at all bus stations.
- Closed circuit TV on new buses in the fleet.
Ferry Services
Description of services
The Transperth ferry service is provided under contract by Captain Cook Cruises.
Two vessels operate between the City (Barrack Street) and South Perth (Mends Street) providing 80 services on an average (summer) weekday.
Patronage
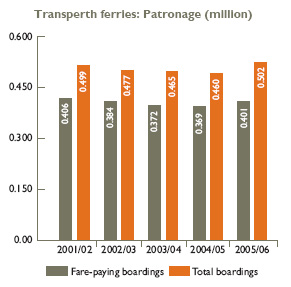
Ferry patronage increased in 2005/06, reversing a negative trend. Previously patronage had declined every year since 2000/01 from a peak of 469,000 fare-paying boardings and 558,000 total boardings. In 2005/06, fare-paying boardings recorded an increase of 8.7 per cent from 369,000 in 2004/05 to 401,000 while total boardings rose by 9.1 per cent from 460,000 to 502,000.
On a per kilometre basis, fare-paying boardings, which had fallen to 10.209 in 2004/05, increased by 13.8 per cent to 11.620. Total boardings were 14.547 per service kilometre in 2005/06, an increase of 14.3 per cent over 12.731 recorded in 2004/05.
Customer Satisfaction
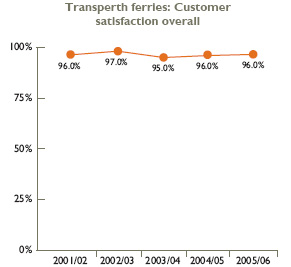
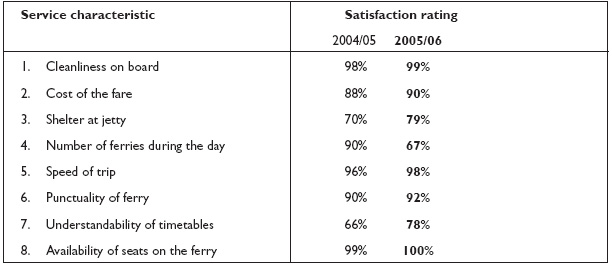
The Passenger Satisfaction Monitor 2006 continued the trend of a very high proportion of passengers consistently expressing satisfaction with Transperth’s ferry services overall.
Satisfaction ratings for key service characteristics of Transperth’s ferry services (other than passenger safety) are shown below (in order of importance):
Passenger Safety
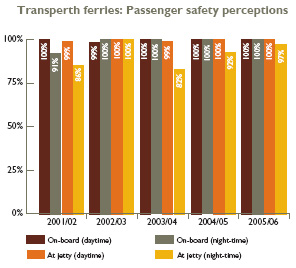
In the Passenger Satisfaction Monitor 2006, ferry users were asked: “How safe do you generally feel from personal interference or threat from other passengers?”
The graph shows the proportion of respondents who “always or usually feel safe” at the specified times/locations on the ferry.
The results for the past five years show that almost all ferry passengers generally felt safe on-board the ferry during the day and at night. Similarly, while almost all users felt safe at the jetty during the day, the proportion of users who felt safe at the jetty at night has increased significantly over the past three years.
>> Go to top